Getting Started
Welcome to 4D-Atlas — a comprehensive 4D spatiotemporal transcriptomics database.
4D-Atlas provides interactive tools for exploring gene expression patterns across developmental timepoints, species, and tissues. This guide walks you through every page and feature.
Navigation Overview
| Menu | Page | Purpose |
|---|---|---|
| HOME | Homepage | Platform overview, statistics, tool previews |
| BROWSE | Browse Data | Filter and explore all datasets |
| SEARCH | Global Search | Search genes, pathways, TFs across all tools |
| TOOLS ▾ | 7 Analysis Tools | Interactive analysis pages |
| DOWNLOAD | Download Center | Download datasets and analysis results |
| HELP | This Page | User guide and documentation |
Back to top
Home Page
The main entry point showing platform statistics, tool previews, and contact information.
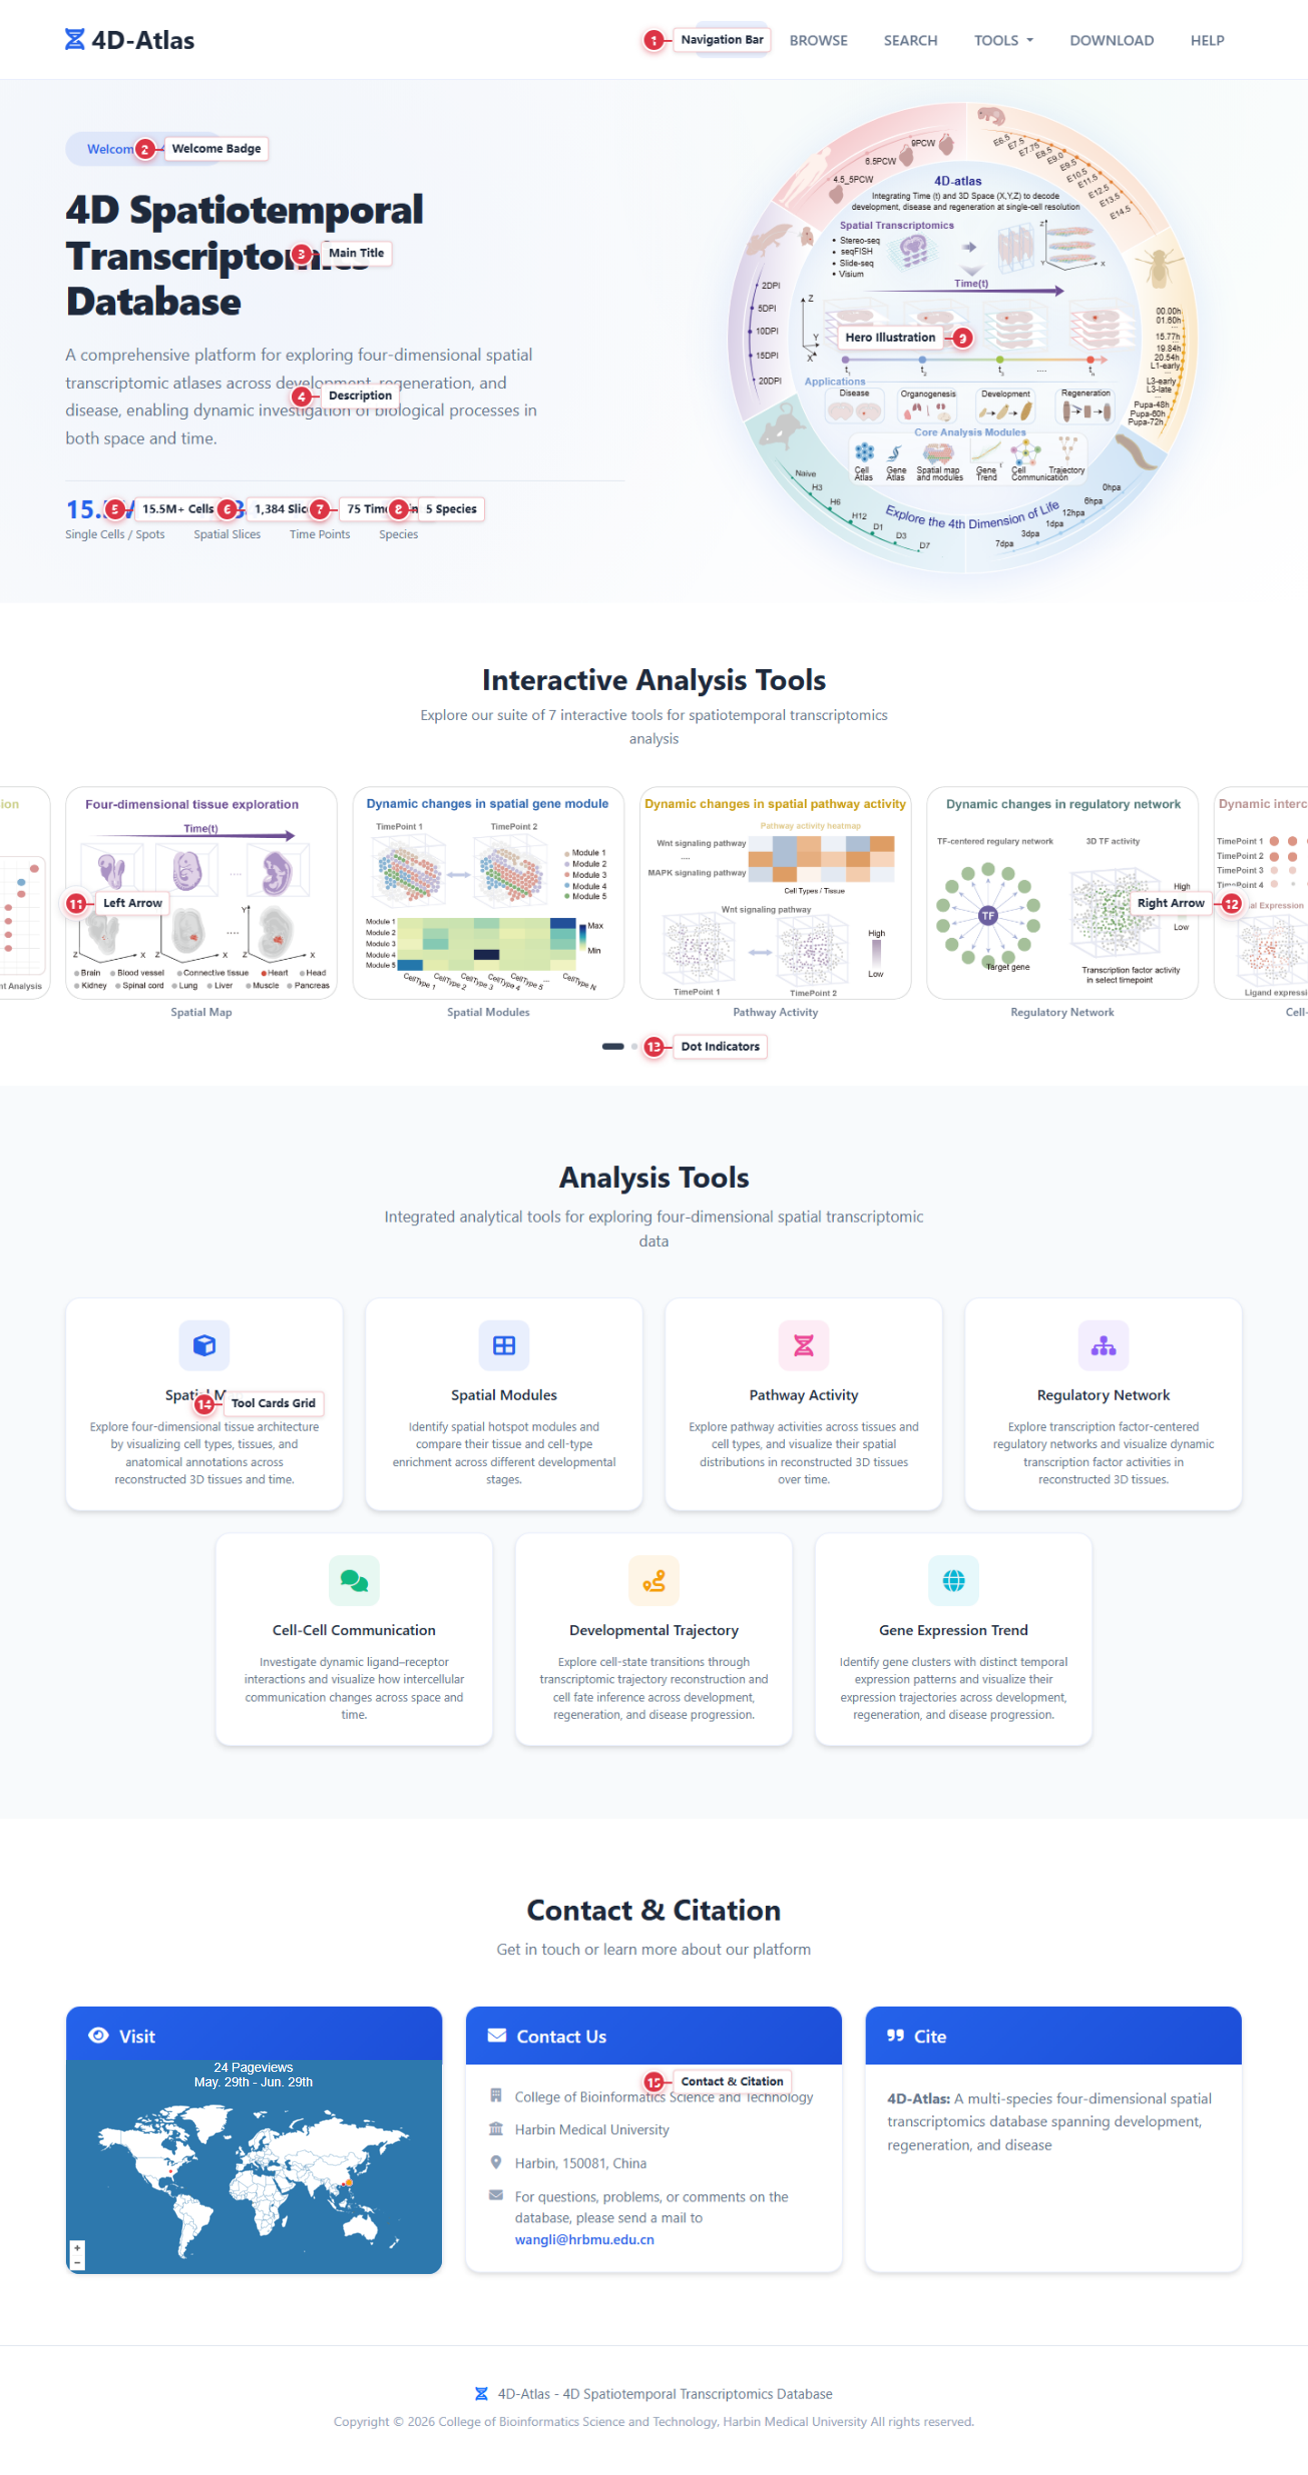
| # | Element | Description |
|---|---|---|
| 1 | Navigation Bar | Fixed top bar with links to all pages. Click 4D-Atlas logo to return home. |
| 2 | Welcome Badge | "Welcome to 4D-Atlas" badge indicating homepage. |
| 3 | Main Title | "4D Spatiotemporal Transcriptomics Database". |
| 4 | Description Text | Brief overview of the platform's purpose. |
| 5 | Statistics: Cells | Total single cells/spots count (22.2M+). |
| 6 | Statistics: Slices | Total spatial slices (1,629). |
| 7 | Statistics: Time Points | Total time points (89). |
| 8 | Statistics: Datasets | Number of datasets (15). |
| 9 | Statistics: Species | Number of species (6). |
| 10 | Hero Illustration | Visual representation of the 4D atlas concept. |
| 11 | Tools Carousel | Auto-scrolling preview of all 7 tools. Click any card to open that tool. |
| 12 | Left Arrow | Scroll carousel left. |
| 13 | Right Arrow | Scroll carousel right. |
| 14 | Dot Indicators | Click to jump to a specific tool preview. |
| 15 | Tool Card | Clickable card for each analysis tool with icon, name, and description. |
| 16 | Visitor Map | Global visitor distribution map + contact and citation info. |
Back to top
Browse
Filter and explore all datasets by species, tissue, and biological process.
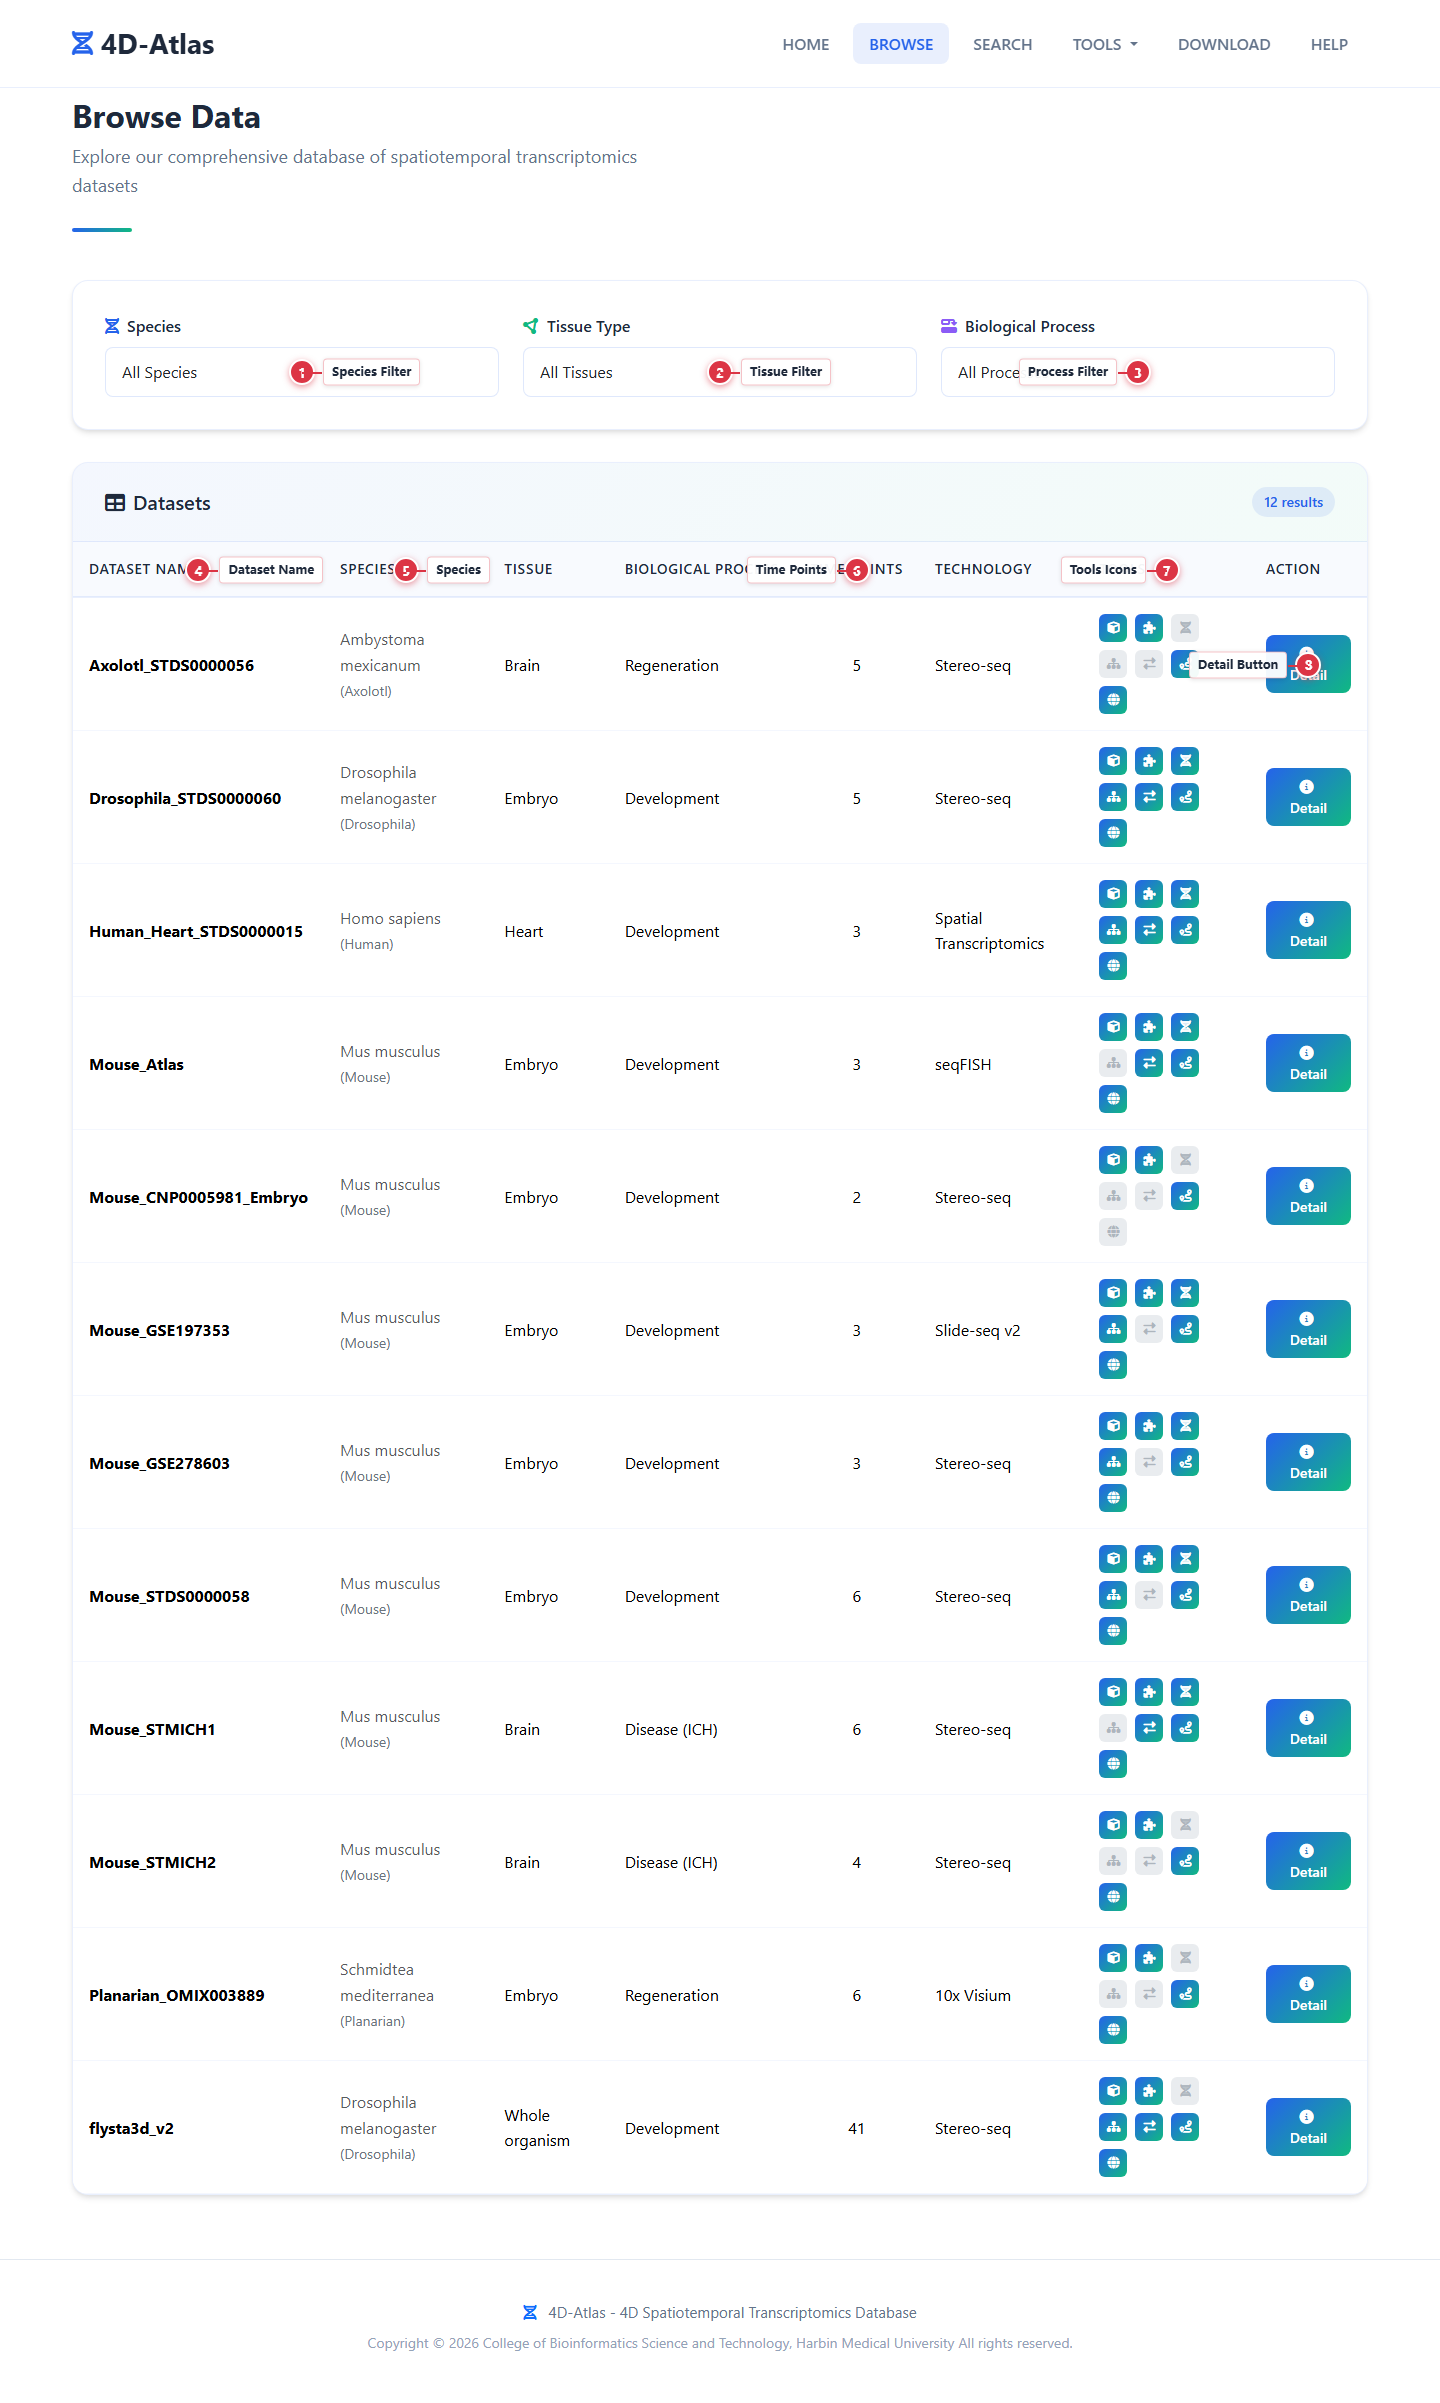
| # | Element | Description |
|---|---|---|
| 1 | Species Filter | Dropdown to filter by species (e.g., Mouse, Human, Drosophila). Updates table in real-time. |
| 2 | Tissue Filter | Dropdown to filter by tissue type (e.g., Brain, Embryo). |
| 3 | Process Filter | Dropdown to filter by biological process (e.g., Development, Regeneration). |
| 4 | Dataset Name | Unique identifier for each dataset (e.g., Mouse_STMICH1). |
| 5 | Species | Species scientific name and common name. |
| 6 | Time Points | Number of developmental timepoints in the dataset. |
| 7 | Tools Icons | 7 tool icons per row. Colorful = available (click to open). Gray = not available. |
| 8 | Detail Button | Click to view full dataset metadata and description. |
Back to top
Search
Global search across all tools — find genes, pathways, TFs, cell types, and more.
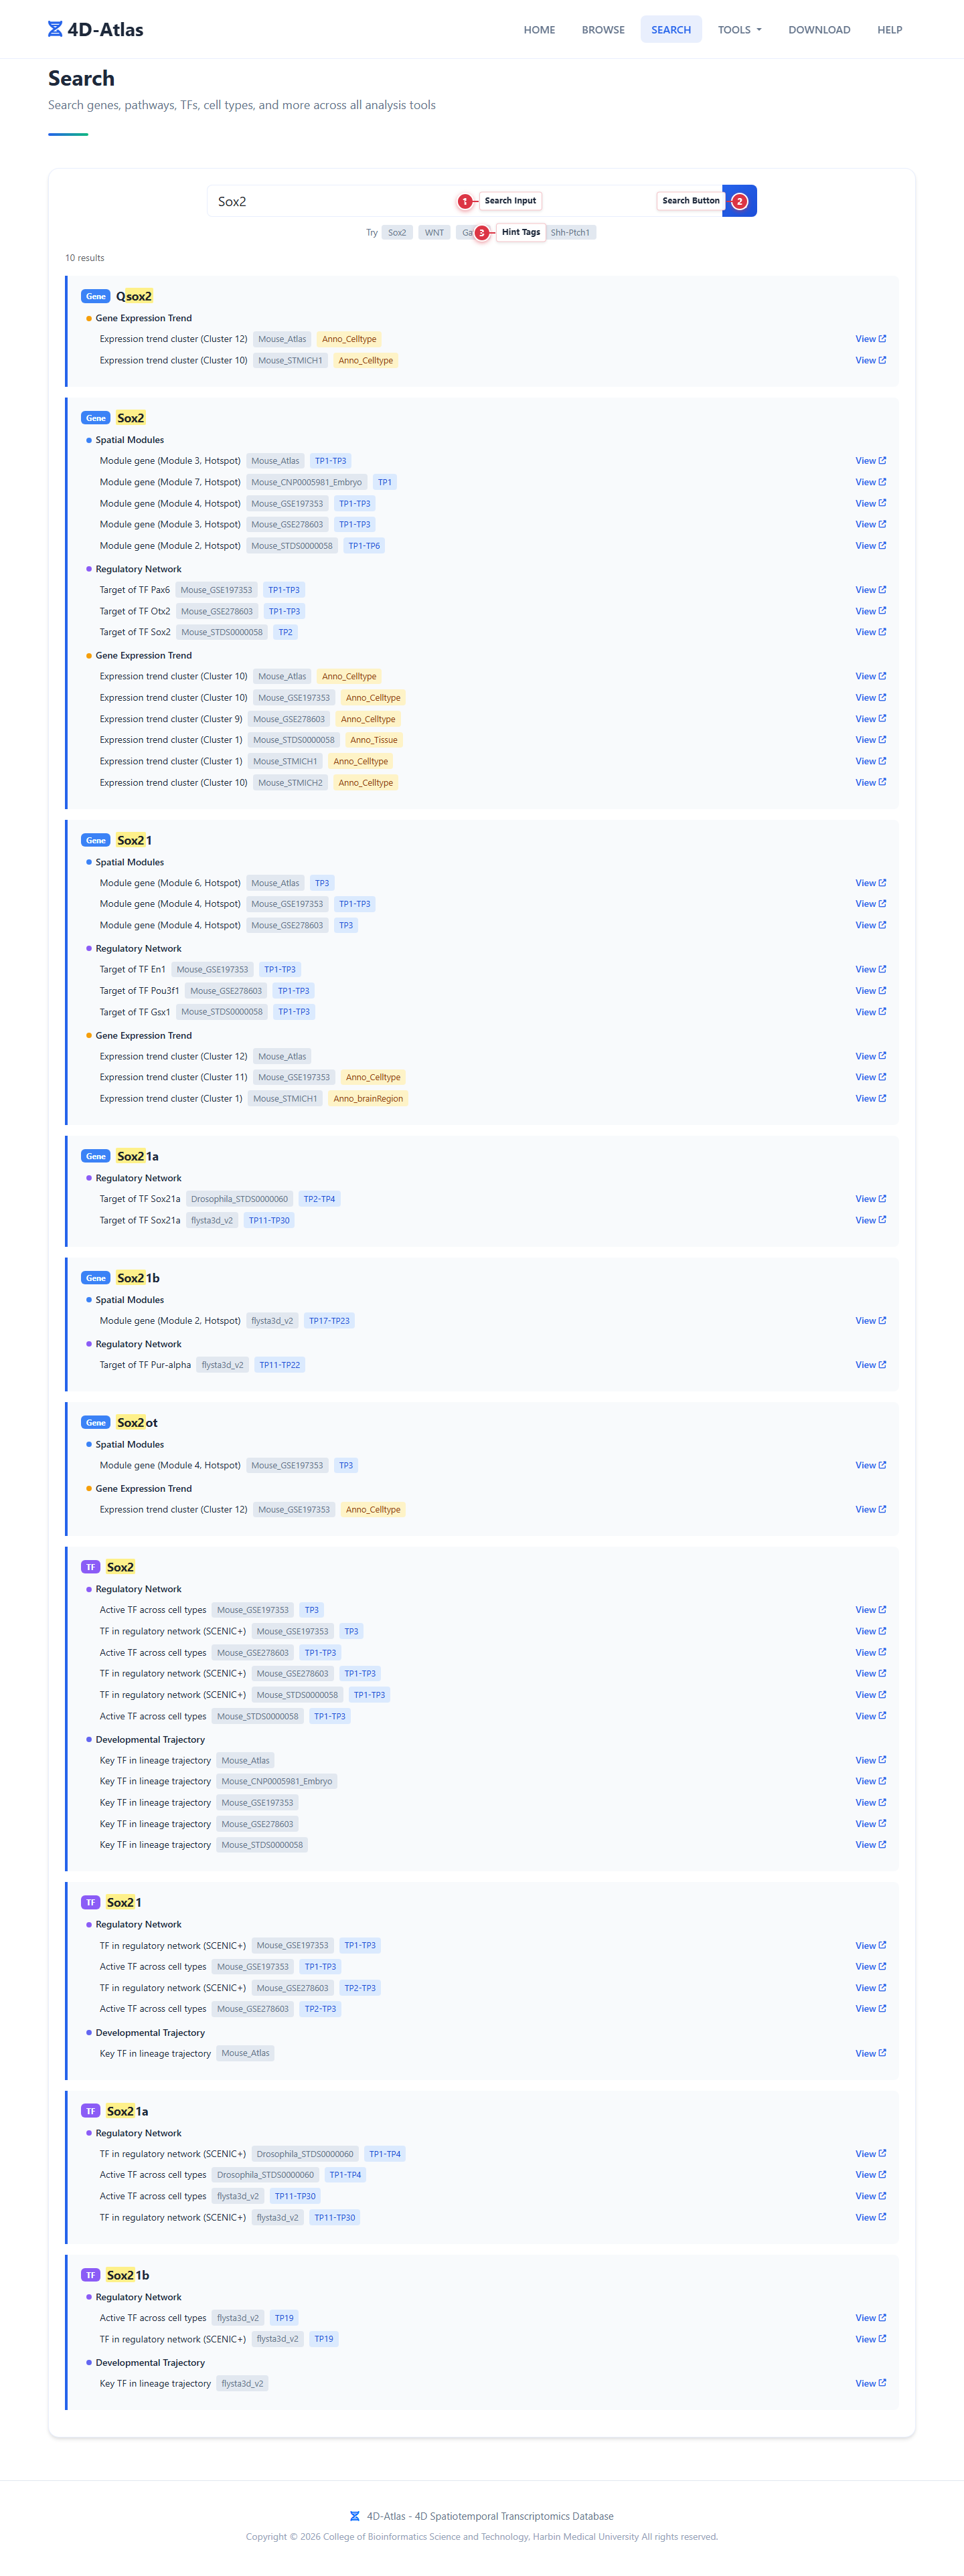
| # | Element | Description |
|---|---|---|
| 1 | Search Input | Type at least 2 characters to trigger search. Supports gene names, pathway names, TF names, etc. |
| 2 | Search Button | Click to execute search (or press Enter). |
| 3 | Hint Tags | Quick-search examples (Sox2, WNT, Gata4, Epiblast, Shh-Ptch1). Click to search. |
| 4 | Type Badge | Entity type badge: Gene · Pathway · TF · Cell Type · LR Pair · Transition |
| 5 | Result Name | Matched entity name with keyword highlighting. Grouped by tool below. |
| 6 | View Link | Click to open the result in the corresponding tool page. |
Back to top
Dataset Detail
Complete metadata for a single dataset, with links to all available analysis tools.
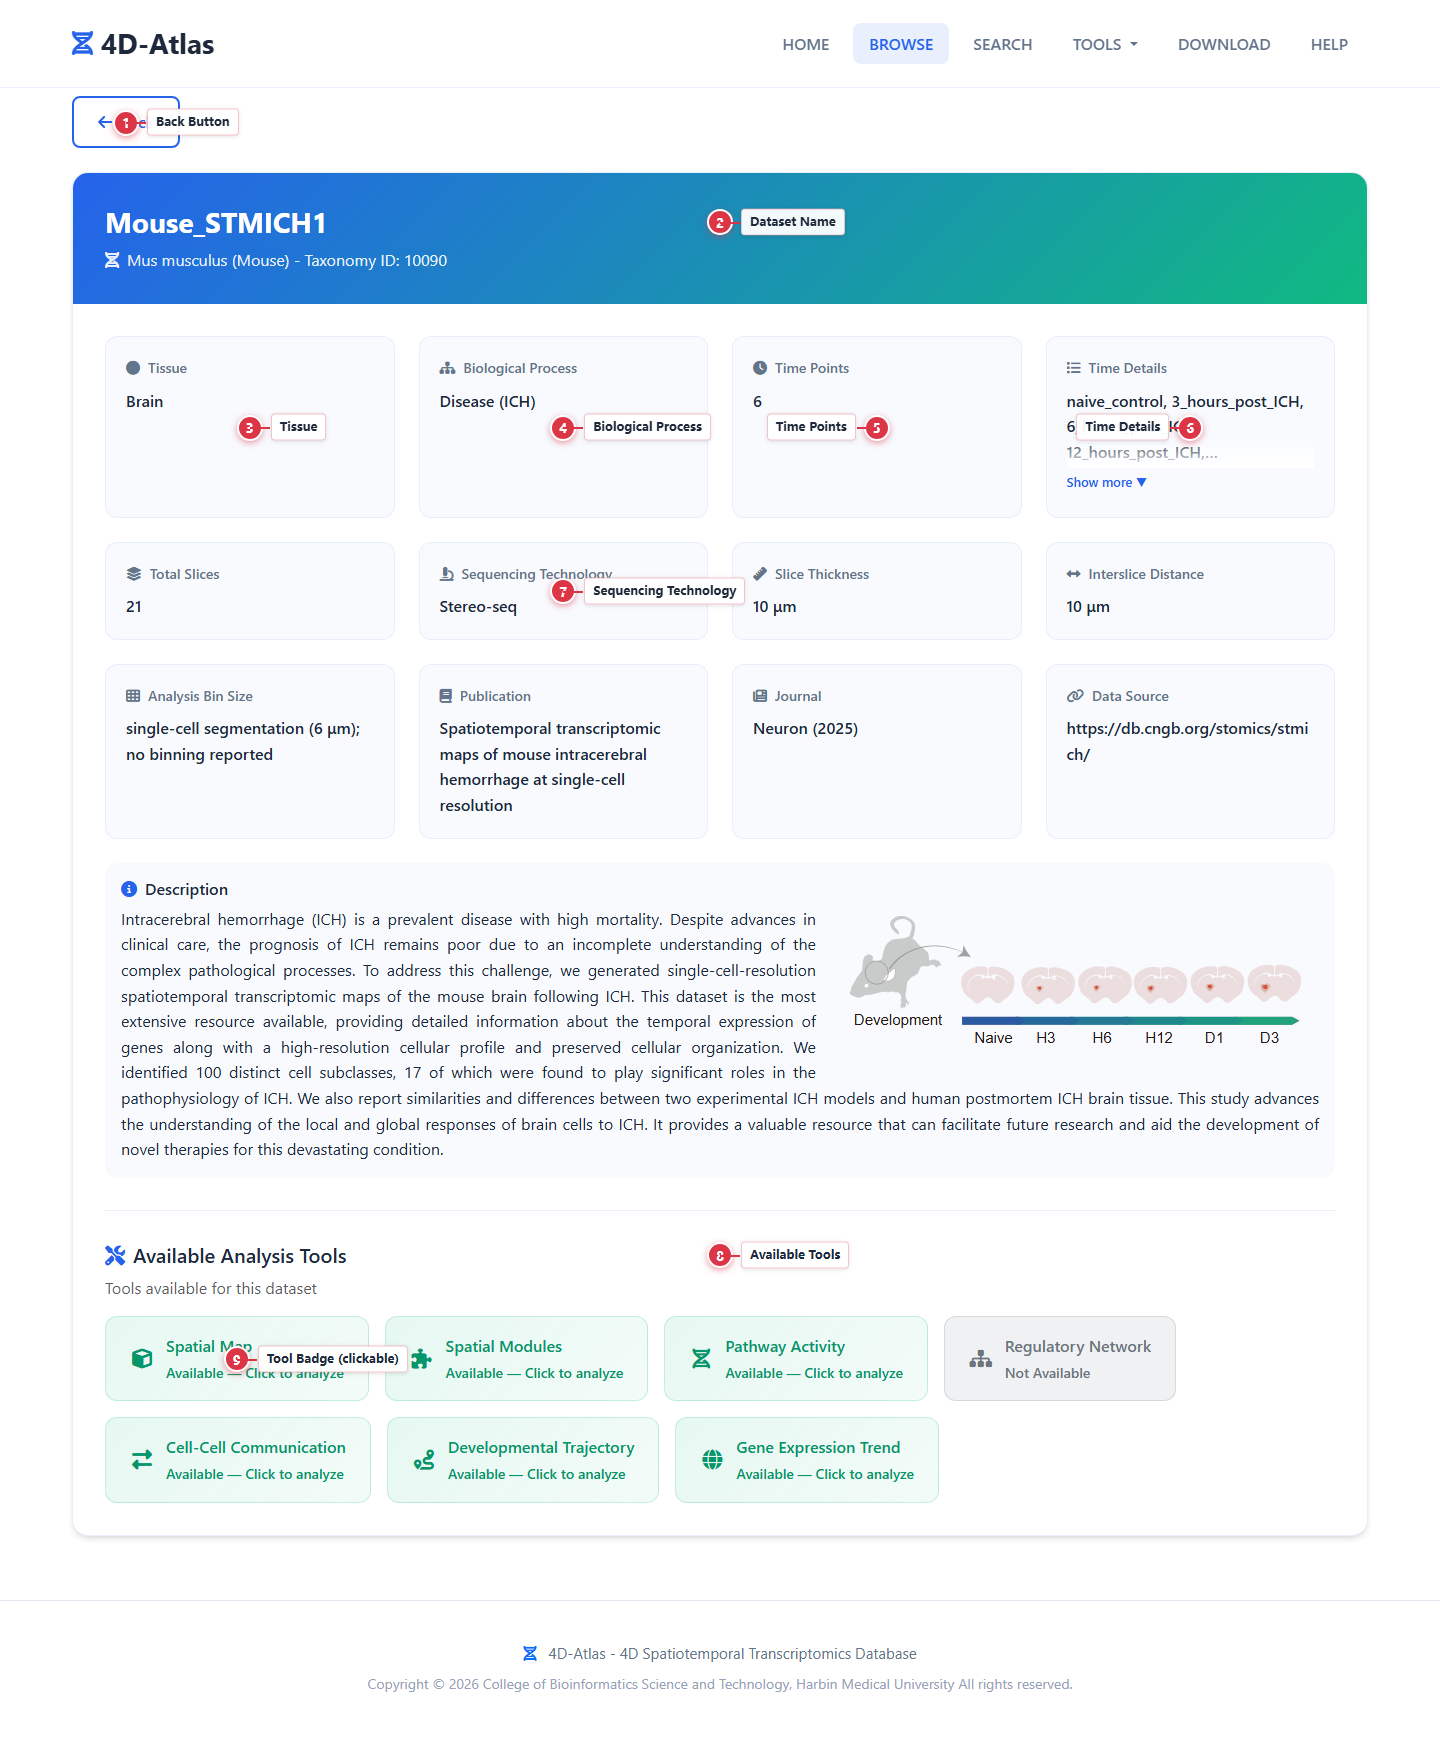
| # | Element | Description |
|---|---|---|
| 1 | Back Button | Return to the previous page. |
| 2 | Dataset Name | Dataset name, species (scientific + common name), taxonomy ID. |
| 3 | Tissue | Tissue type (e.g., Brain, Embryo). |
| 4 | Biological Process | Developmental or biological process. |
| 5 | Time Points | Total number of timepoints. |
| 6 | Time Details | Detailed time labels (expandable with "Show more" button). |
| 7 | Sequencing Technology | Sequencing platform (e.g., Stereo-seq, MERFISH). |
| 8 | Available Tools | Section listing all 7 tools with availability status. |
| 9 | Tool Badge | Green = available (click to analyze). Gray = not available. |
Back to top
Tool 1: Spatial Map
Interactive 3D visualization of cells/spots across developmental timepoints.
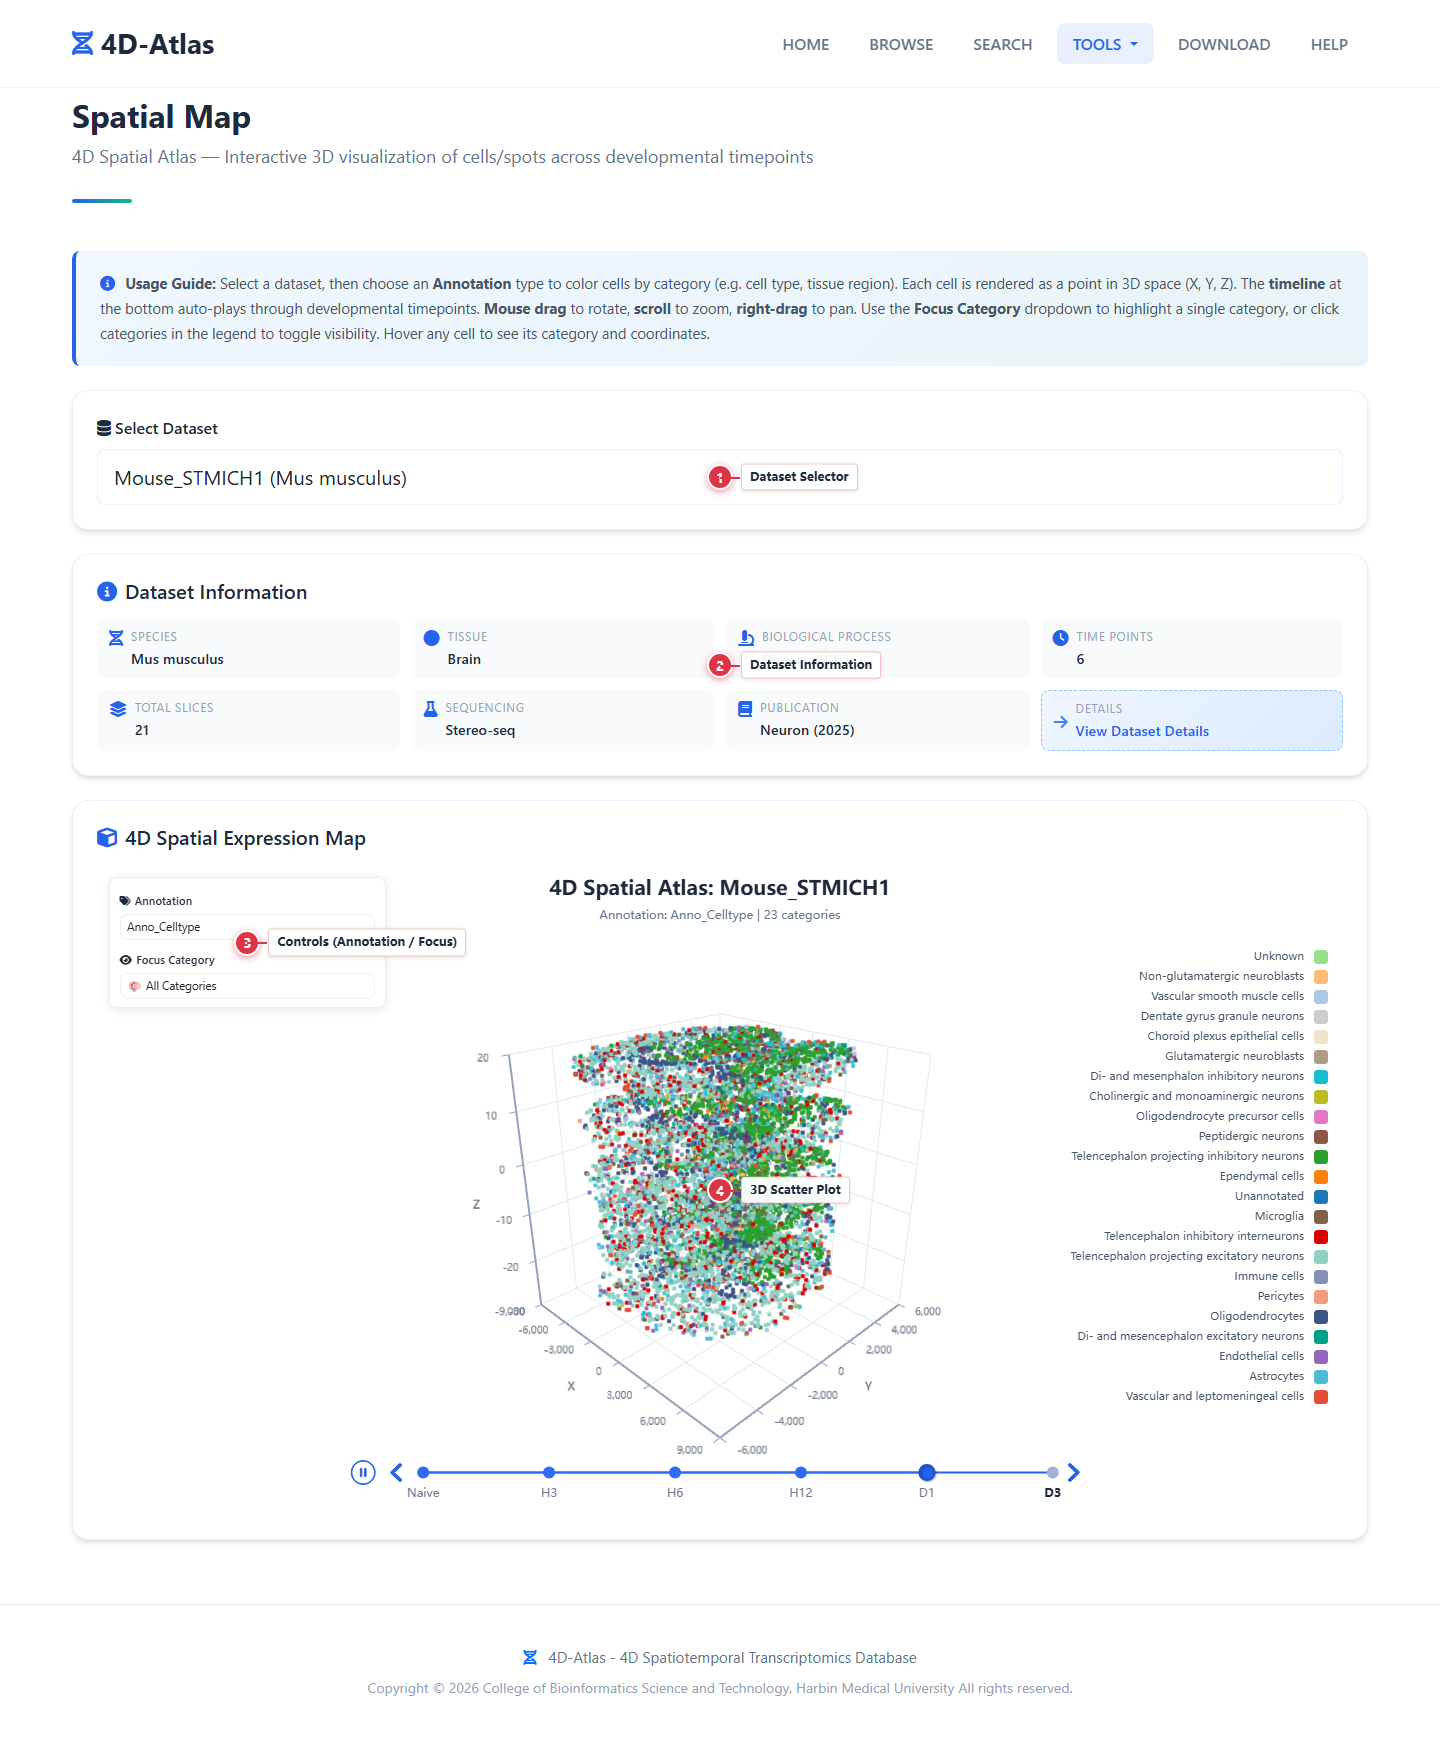
How to Use
- Select a dataset from the dropdown.
- The 3D scatter plot loads automatically — each point is a cell in spatial coordinates (X, Y, Z).
- Use Annotation to change coloring (Cell Type, Tissue, Germ Layer, etc.).
- Use Focus Category to highlight a single cell type; others become transparent.
- The timeline at the bottom auto-plays through timepoints.
Mouse Controls
| Action | Control |
|---|---|
| Rotate | Left-click + drag |
| Zoom | Scroll wheel |
| Pan | Right-click + drag |
| # | Element | Description |
|---|---|---|
| 1 | Dataset Selector | Choose which dataset to visualize. |
| 2 | Dataset Information | Grid showing species, tissue, time points, etc. |
| 3 | Controls (Annotation / Focus) | Floating panel to switch coloring mode and focus a single category. |
| 4 | 3D Scatter Plot | Cells in 3D space, colored by annotation category, with an auto-playing timeline. |
Back to top
Tool 2: Spatial Modules
Identify and compare spatially coherent gene expression modules across timepoints.
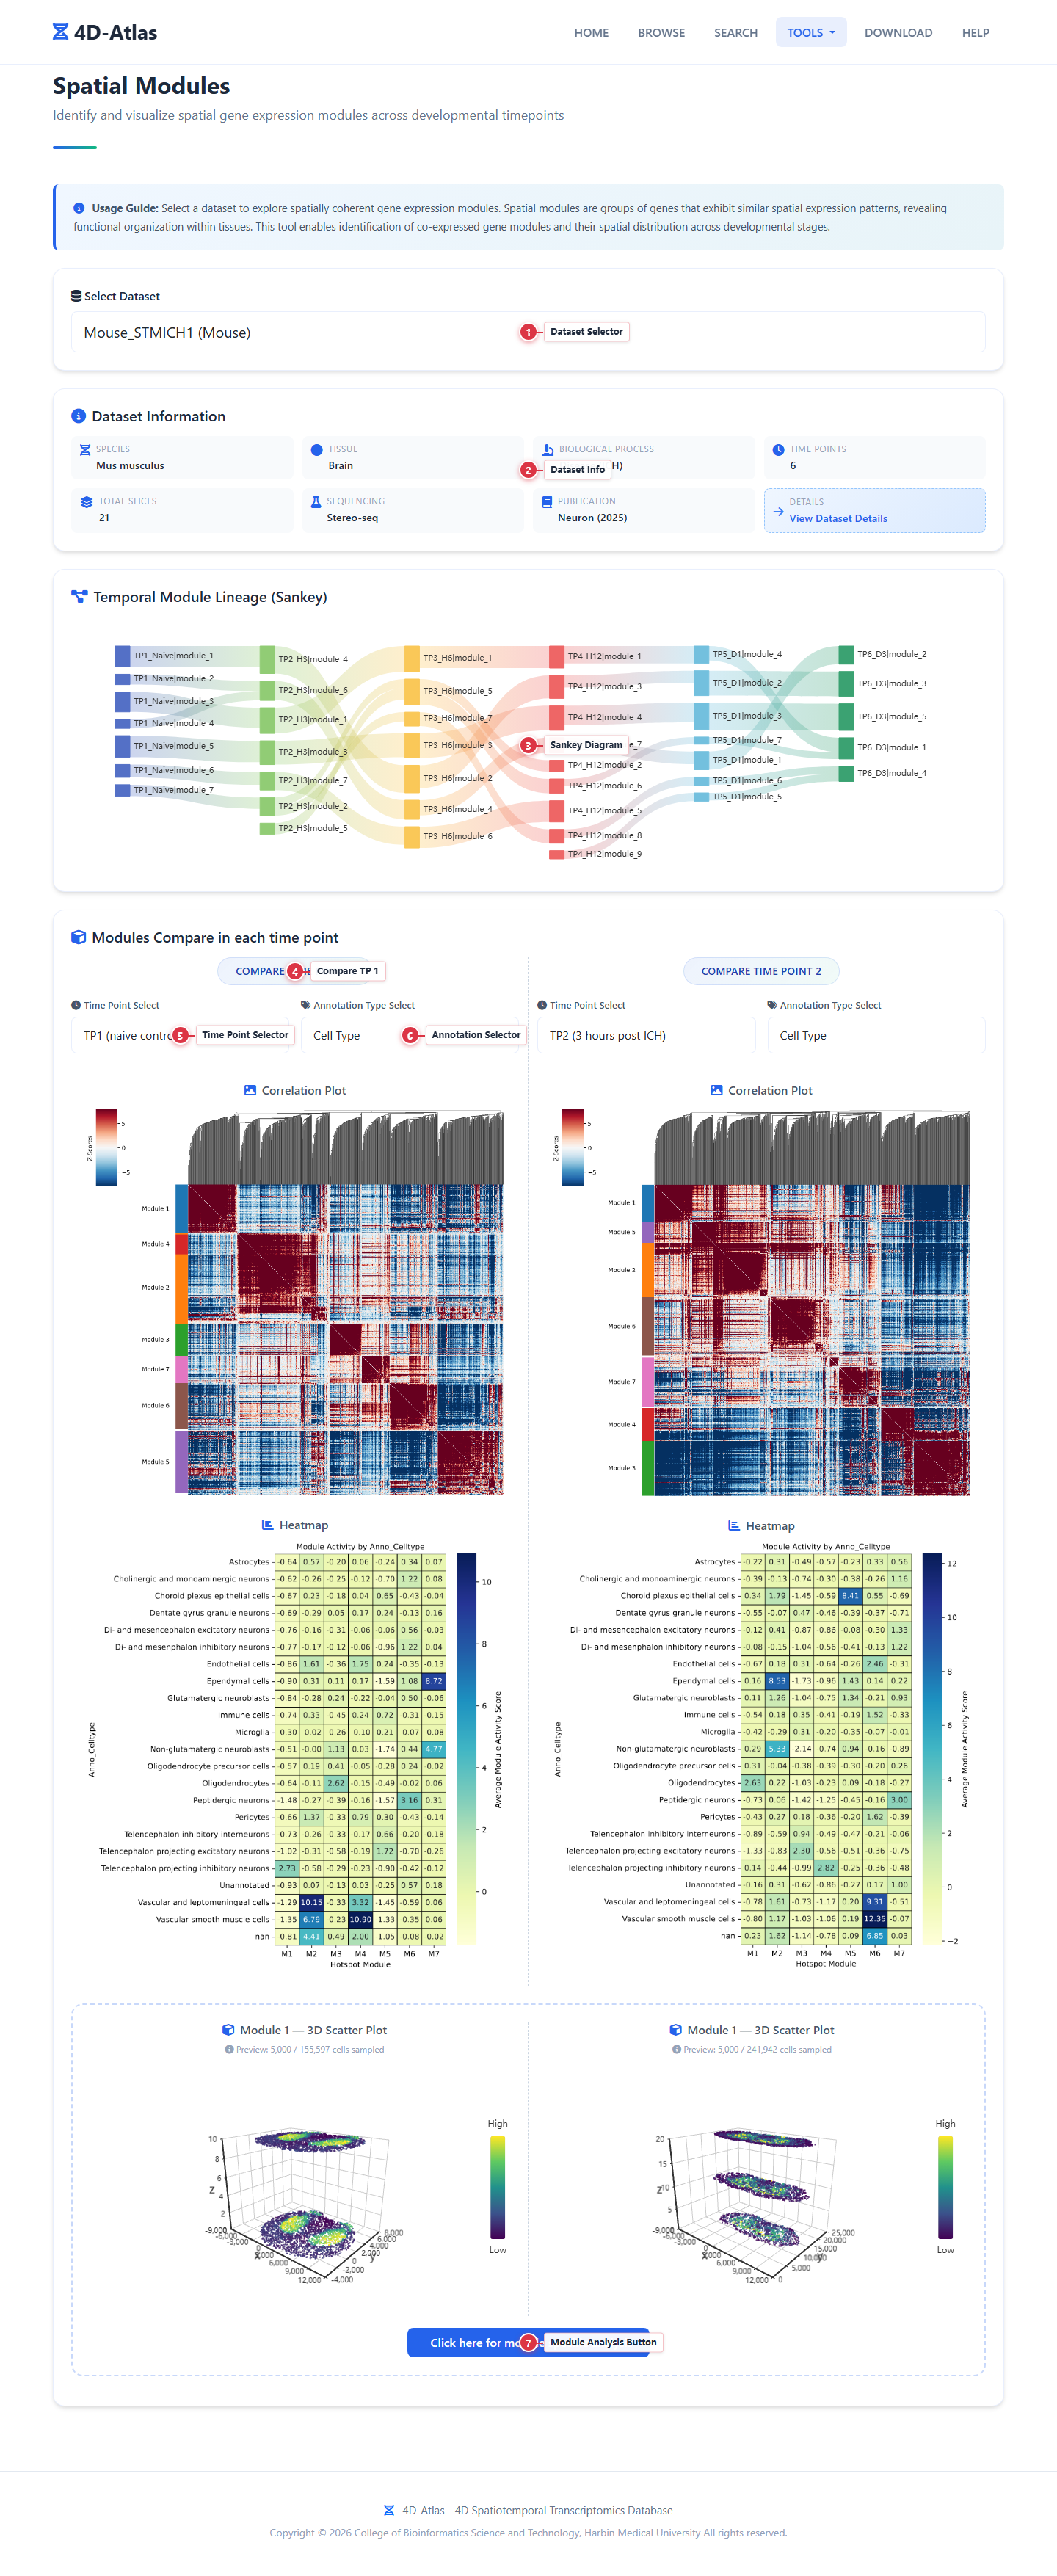
How to Use
- Select a dataset — the Sankey diagram and dual-column comparison load automatically.
- Use Time Point and Annotation Type selectors in each column to compare two timepoints.
- Each column shows a Correlation Plot and a Heatmap.
- Click "Click here for module specific analysis" to expand detailed module exploration.
- In expanded view: select a module to see 3D scatter, 2D scatter, gene list, and GO/KEGG enrichment.
| # | Element | Description |
|---|---|---|
| 1 | Dataset Selector | Choose which dataset to analyze. |
| 2 | Dataset Info | Grid showing species, tissue, time points, etc. |
| 3 | Sankey Diagram | Module lineage transitions across timepoints. |
| 4 | Compare Time Point 1 | Left column header — first comparison timepoint. |
| 5 | Time Point Selector | Choose timepoint for each column. |
| 6 | Annotation Selector | Choose annotation type for heatmap grouping. |
| 7 | Module Analysis Button | Expands full module analysis panel with 3D/2D plots, gene tables, enrichment. |
Back to top
Tool 3: Pathway Activity
Analyze signaling pathway activities using Hallmark and PROGENy gene sets.
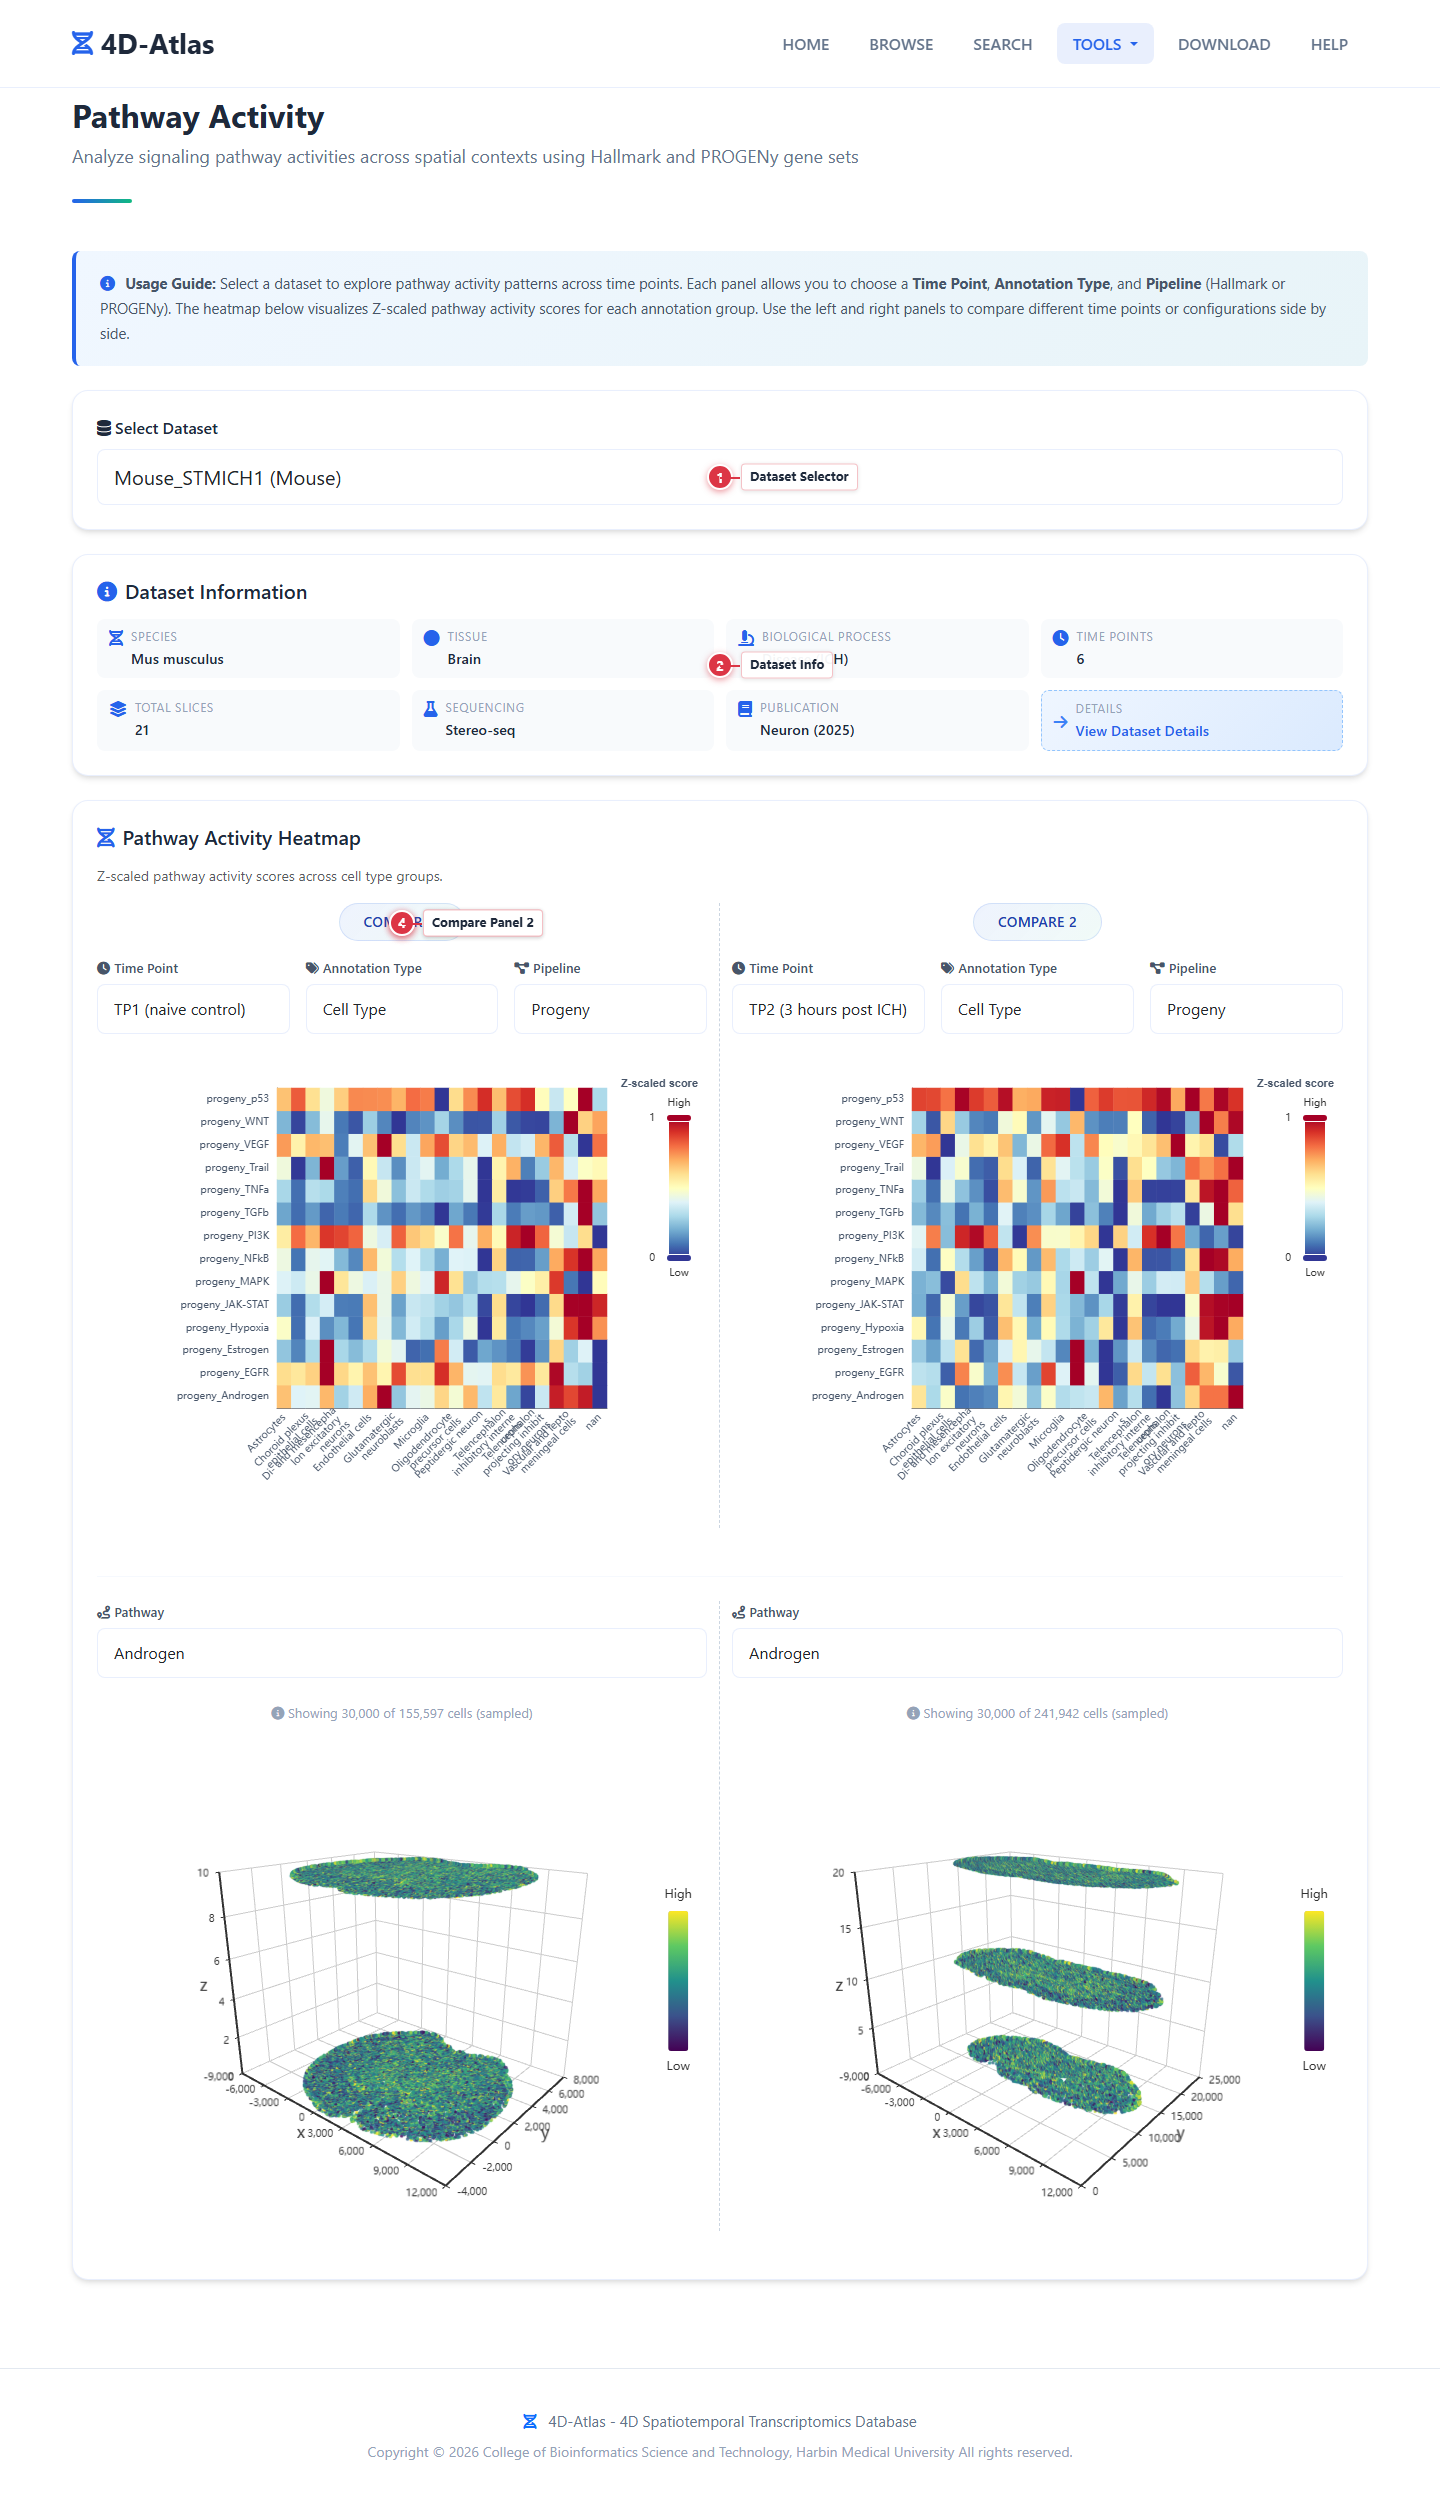
How to Use
- Select a dataset — the info grid loads automatically.
- Use left/right panels to compare different Time Points, Annotation Types, and Pipelines.
- The heatmap shows Z-scaled pathway activity scores per annotation group.
- Select a pathway to see its 3D spatial distribution.
| # | Element | Description |
|---|---|---|
| 1 | Dataset Selector | Choose which dataset to analyze. |
| 2 | Dataset Info | Grid showing species, tissue, time points, etc. |
| 3 | Compare Panel 1 | Left comparison panel header. |
| 4 | Compare Panel 2 | Right comparison panel header. |
Back to top
Tool 4: Regulatory Network
Construct spatial gene regulatory networks and explore transcription factor activities.
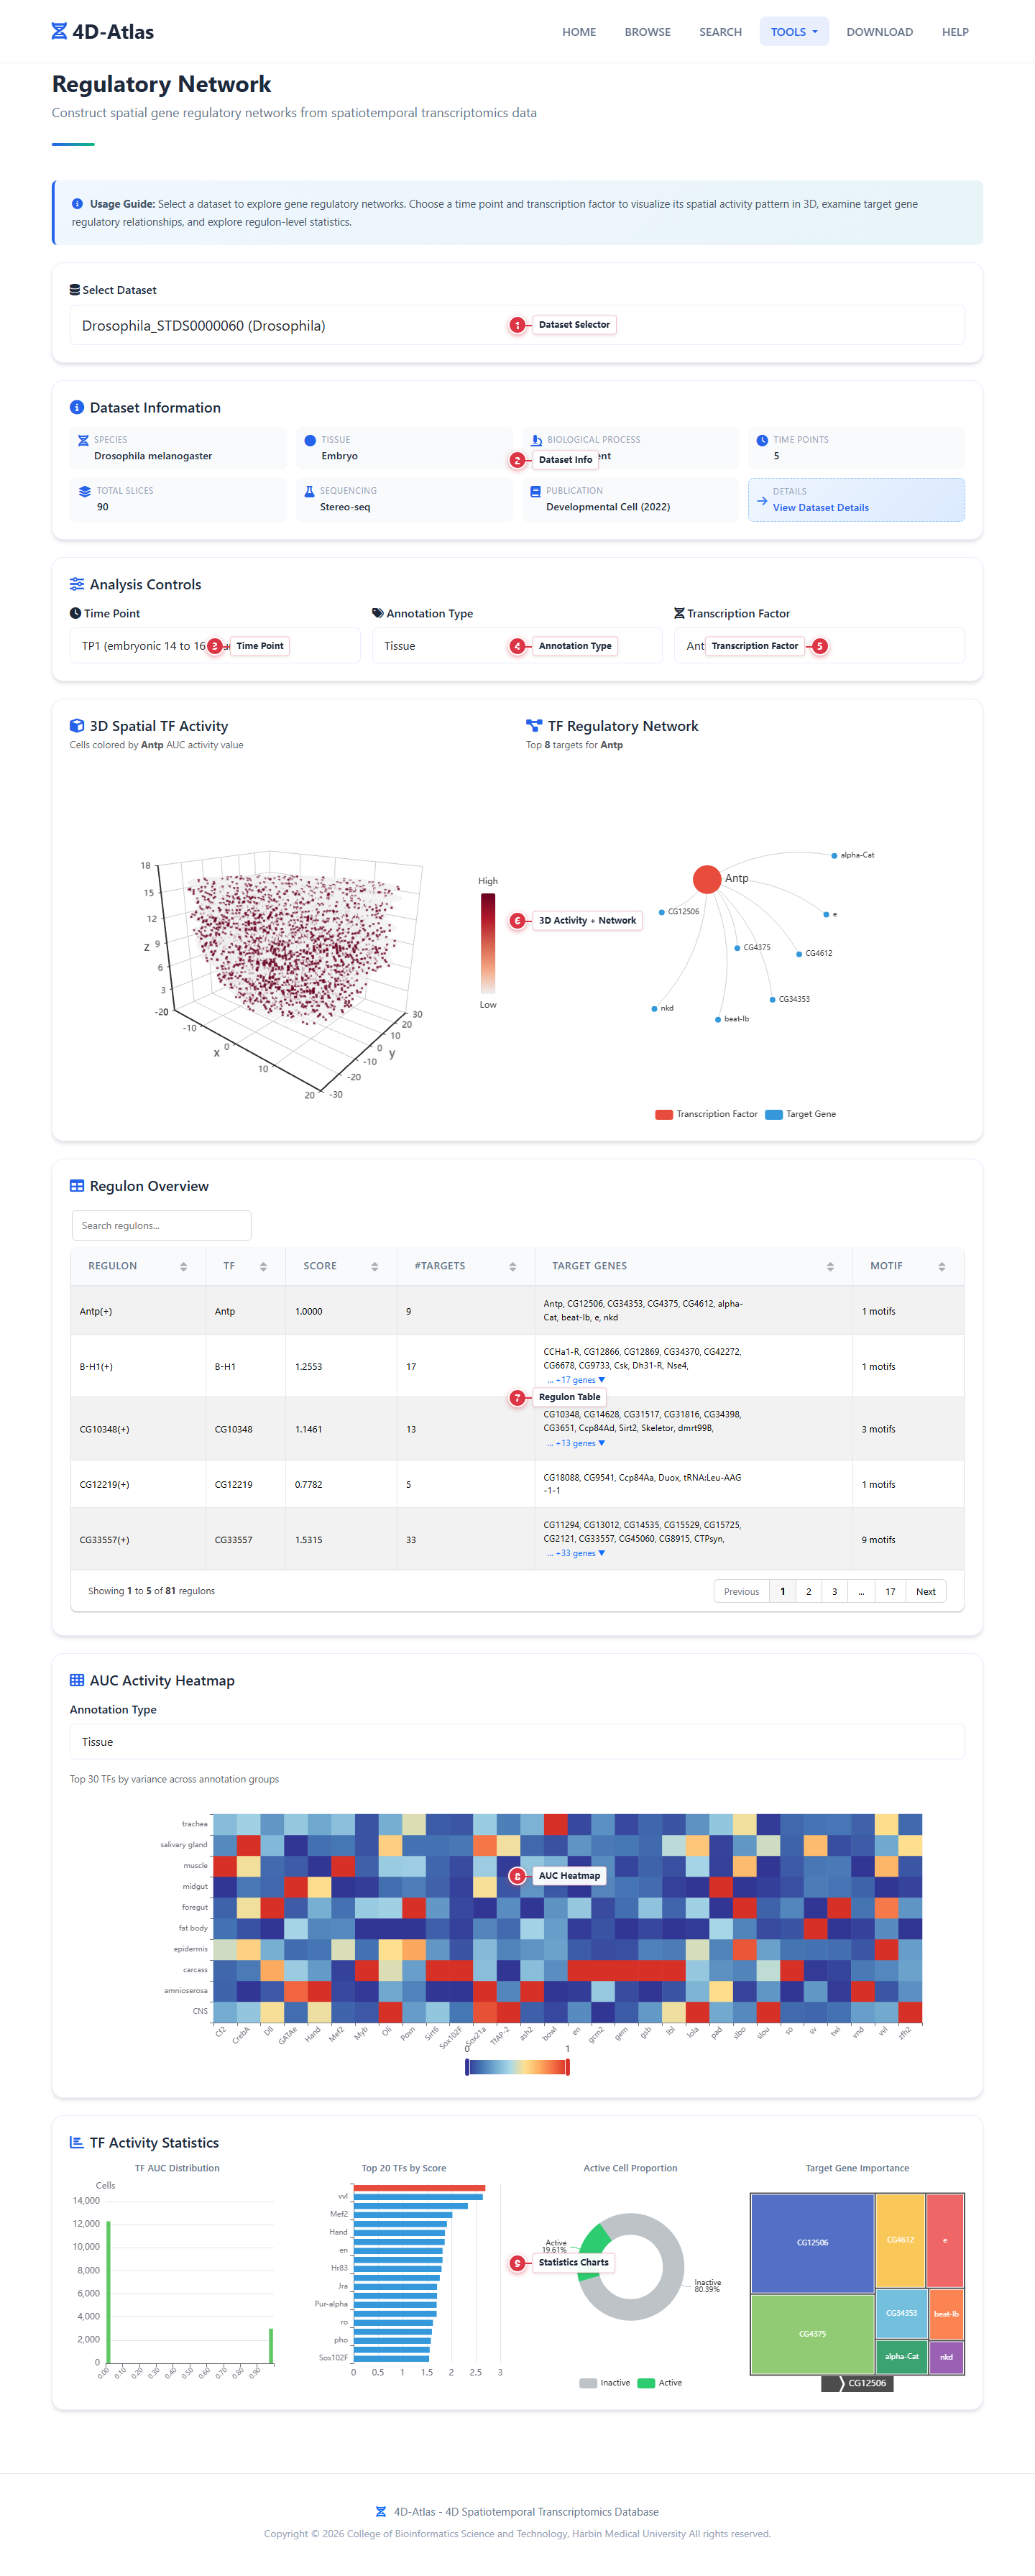
How to Use
- Select a dataset, then choose an Annotation Type and Transcription Factor.
- The TF Activity Dynamics heatmap shows TF activity across all timepoints — click a TF row to focus it in 3D space.
- View the TF's 3D spatial activity and its regulatory network (top 20 targets). Use the time player (prev / play / next / slider) to animate through timepoints.
- Browse the Regulon Overview table for all TFs.
- Explore the AUC Heatmap and TF Activity Statistics.
| # | Element | Description |
|---|---|---|
| 1 | Dataset Selector | Choose which dataset to analyze. |
| 2 | Dataset Info | Grid showing species, tissue, time points, etc. |
| 3 | Annotation Type | Choose annotation for heatmap grouping. |
| 4 | Transcription Factor | Choose transcription factor to analyze. |
| 5 | TF Activity Dynamics | TF × Timepoint heatmap overview. Click a TF row to focus it in 3D space. Has a TF name search box. |
| 6 | 3D Activity + Network | Side-by-side: 3D TF activity scatter + regulatory network graph, with a time player. |
| 7 | Regulon Table | All regulons with TF name, score, target count, motif info. |
| 8 | AUC Heatmap | Top 30 TFs by variance across annotation groups. |
| 9 | Statistics Charts | AUC distribution, top TFs, active cell proportion, target importance. |
Back to top
Tool 5: Cell-Cell Communication
Analyze cell-cell signaling networks and ligand-receptor interactions.
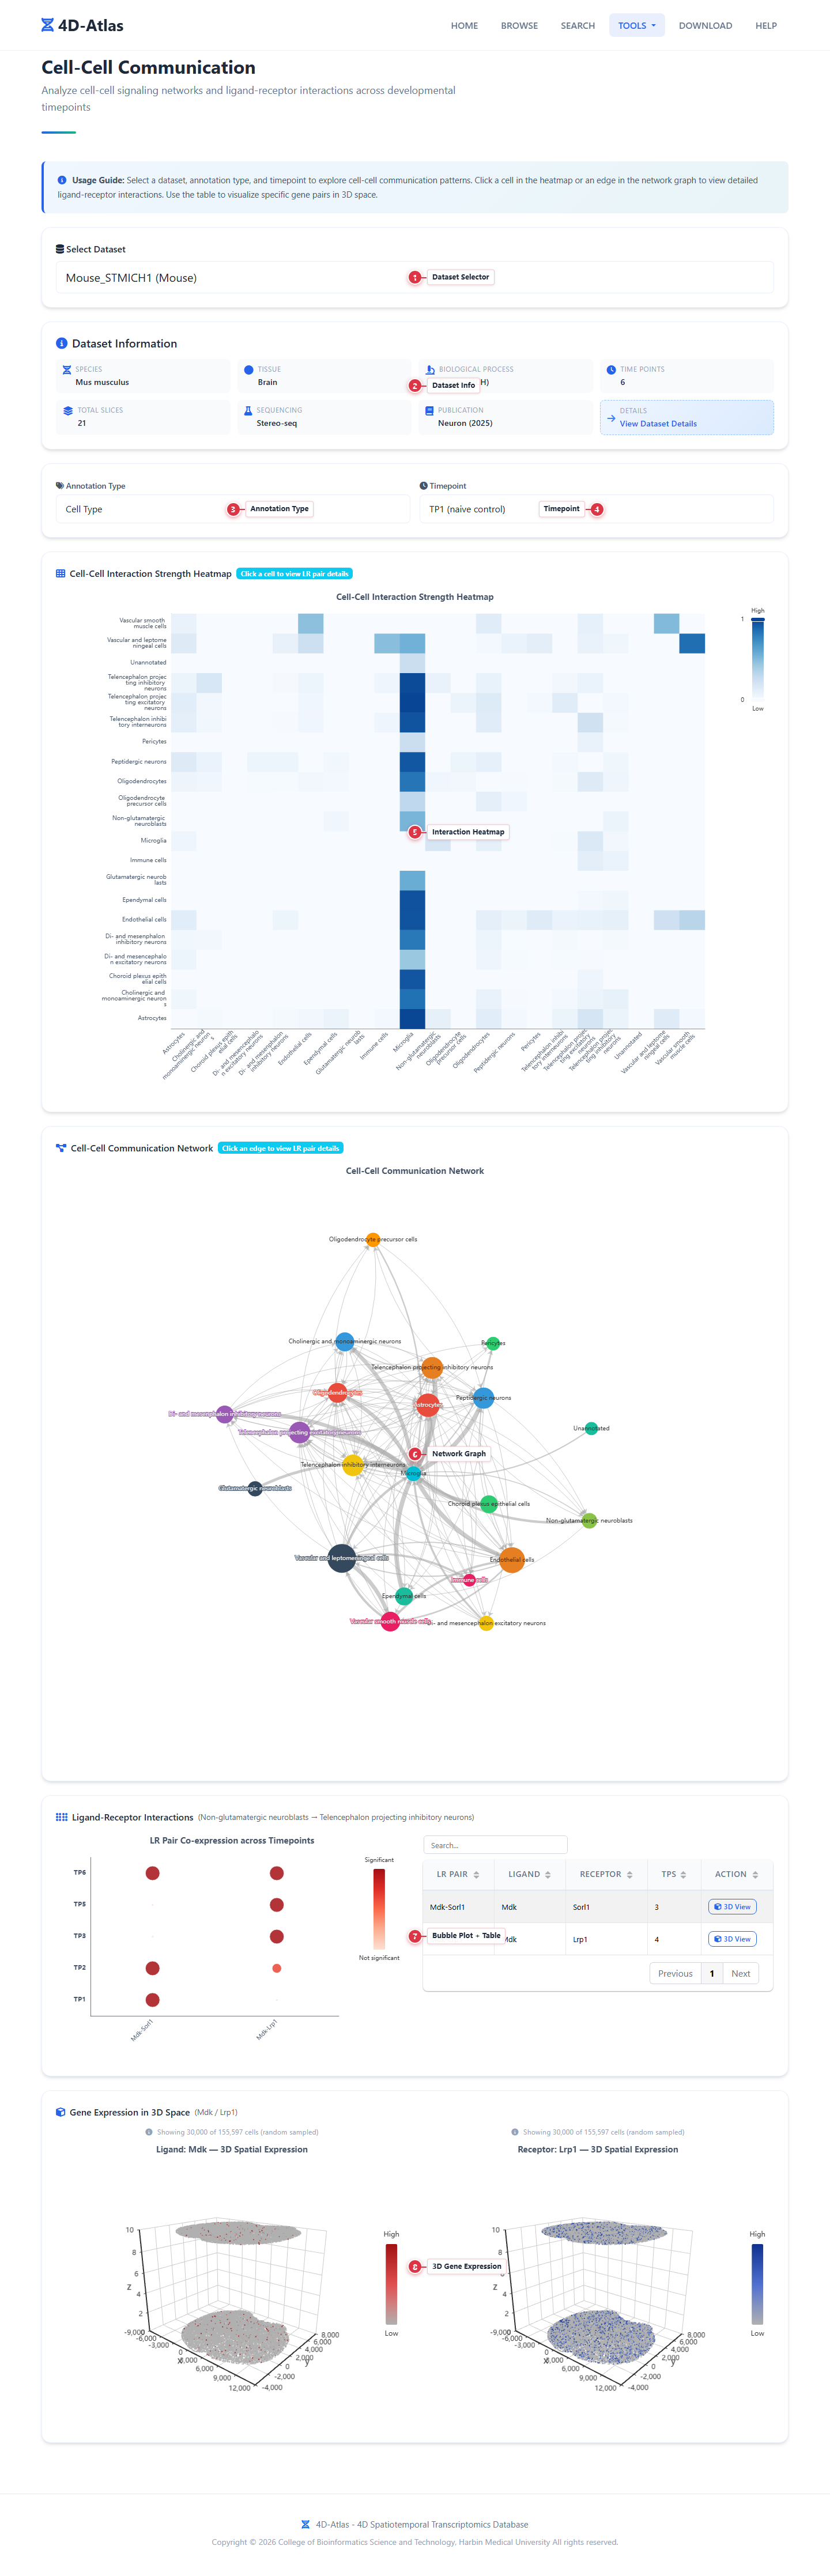
How to Use
- Select a dataset, then choose an Annotation Type.
- The Communication Dynamics heatmap shows Pair × Timepoint interaction strength — click a cell to focus that pair in 3D space.
- The 3D Spatial View shows where communication happens, with a time player (prev / play / next / slider).
- The Network Graph visualizes communication as directed edges — click an edge to view LR pair details.
- Use the Bubble Plot and Table to explore specific ligand-receptor pairs.
- Click a gene in the table to see its 3D spatial expression.
| # | Element | Description |
|---|---|---|
| 1 | Dataset Selector | Choose which dataset to analyze. |
| 2 | Dataset Info | Grid showing species, tissue, time points, etc. |
| 3 | Annotation Type | Choose annotation (e.g., Cell Type, Tissue). |
| 4 | Communication Dynamics | Pair × Timepoint heatmap. Click a cell to focus that pair in 3D space. Has a cell-type search box. |
| 5 | 3D Spatial View | Where communication happens in 3D space, with a time player (prev / play / next / slider). |
| 6 | Network Graph | Directed network of cell-cell communication. Click an edge for details. |
| 7 | Bubble Plot + Table | LR pair details: bubble plot (top 20) + full table (Grid.js). |
| 8 | 3D Gene Expression | Ligand and receptor expression in 3D spatial coordinates. |
Back to top
Tool 6: Developmental Trajectory
Trace developmental trajectories with TOME and CellRank analysis.
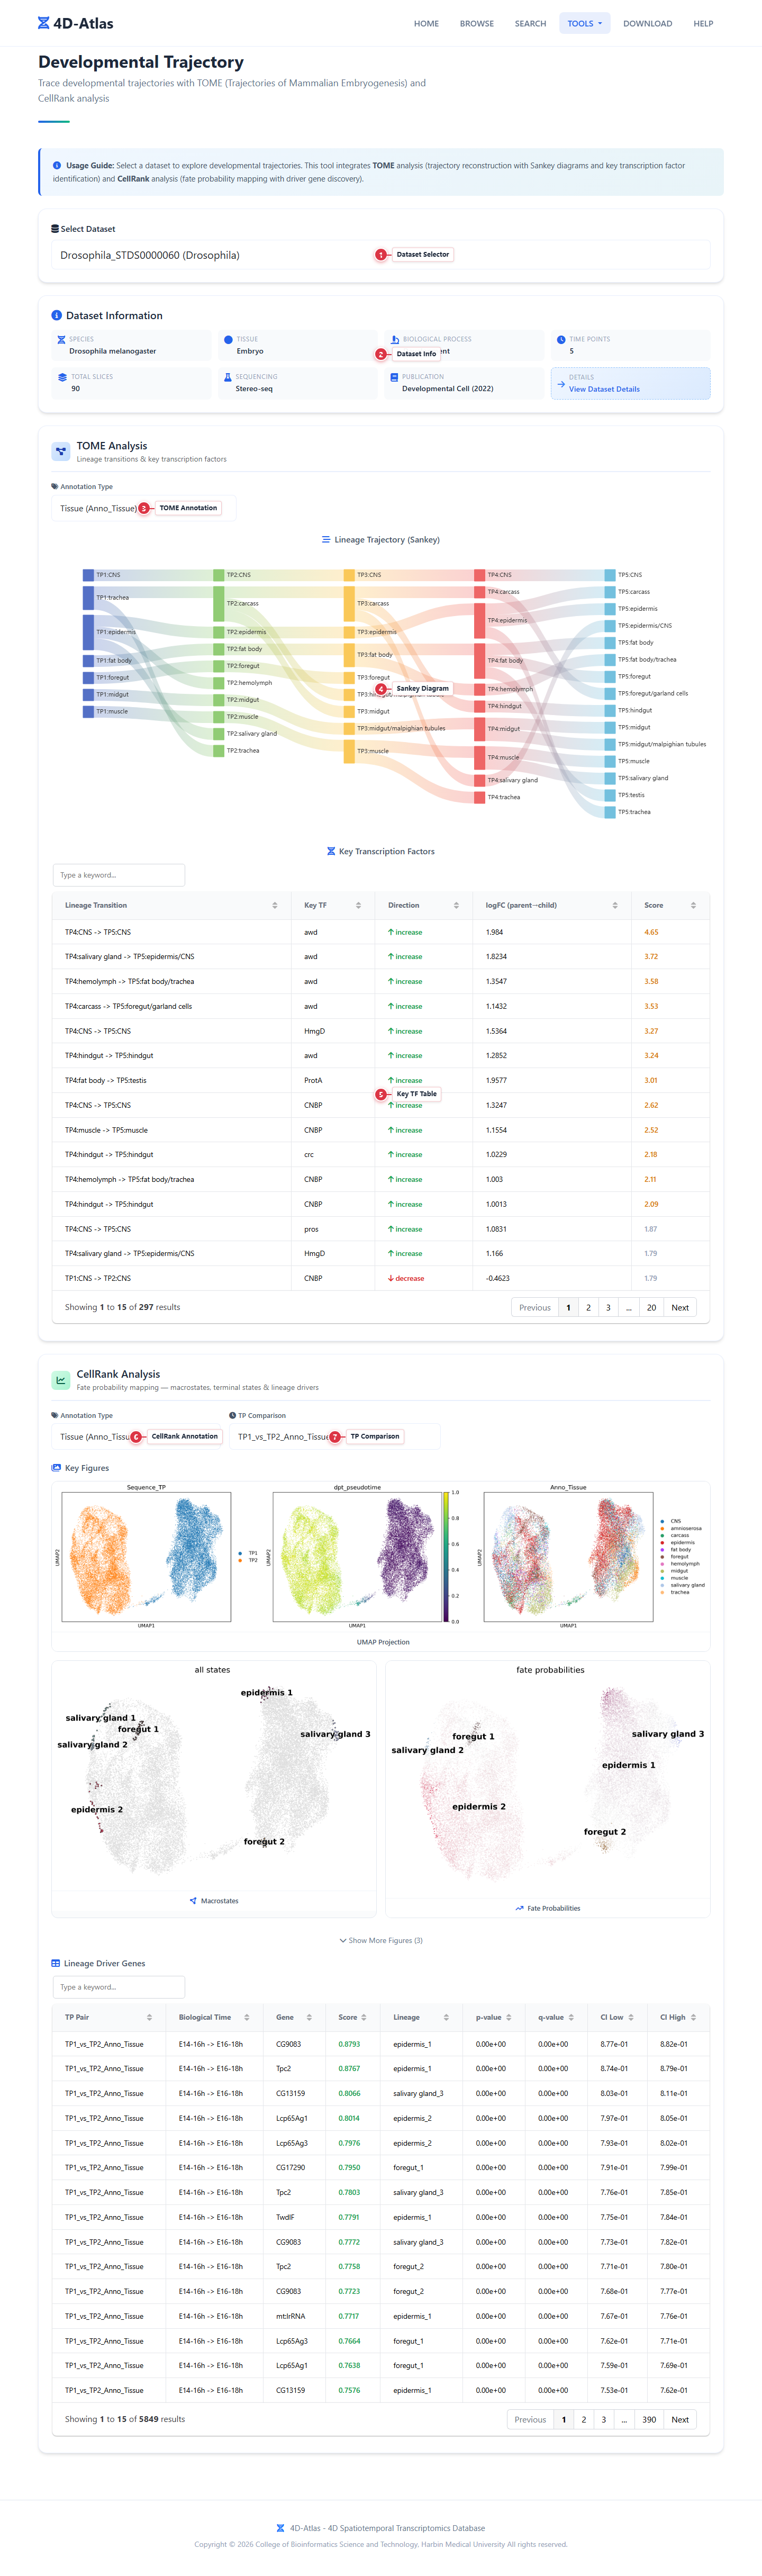
How to Use
- Select a dataset — TOME and CellRank sections load automatically.
- TOME: Choose annotation → see Sankey diagram + key TF table.
- CellRank: Choose annotation + TP comparison → see UMAP figures, fate maps, driver genes.
- Click figures to enlarge (lightbox view).
| # | Element | Description |
|---|---|---|
| 1 | Dataset Selector | Choose which dataset to analyze. |
| 2 | Dataset Info | Grid showing species, tissue, time points, etc. |
| 3 | TOME Annotation | Choose annotation type for TOME analysis. |
| 4 | Sankey Diagram | Cell type transitions across timepoints (lineage trajectory). |
| 5 | Key TF Table | Transcription factors driving each lineage transition. |
| 6 | CellRank Annotation | Choose annotation type for CellRank analysis. |
| 7 | TP Comparison | Choose timepoint pair for CellRank comparison. |
Back to top
Tool 7: Gene Expression Trend
Explore gene expression patterns and functional enrichment across annotation groups.
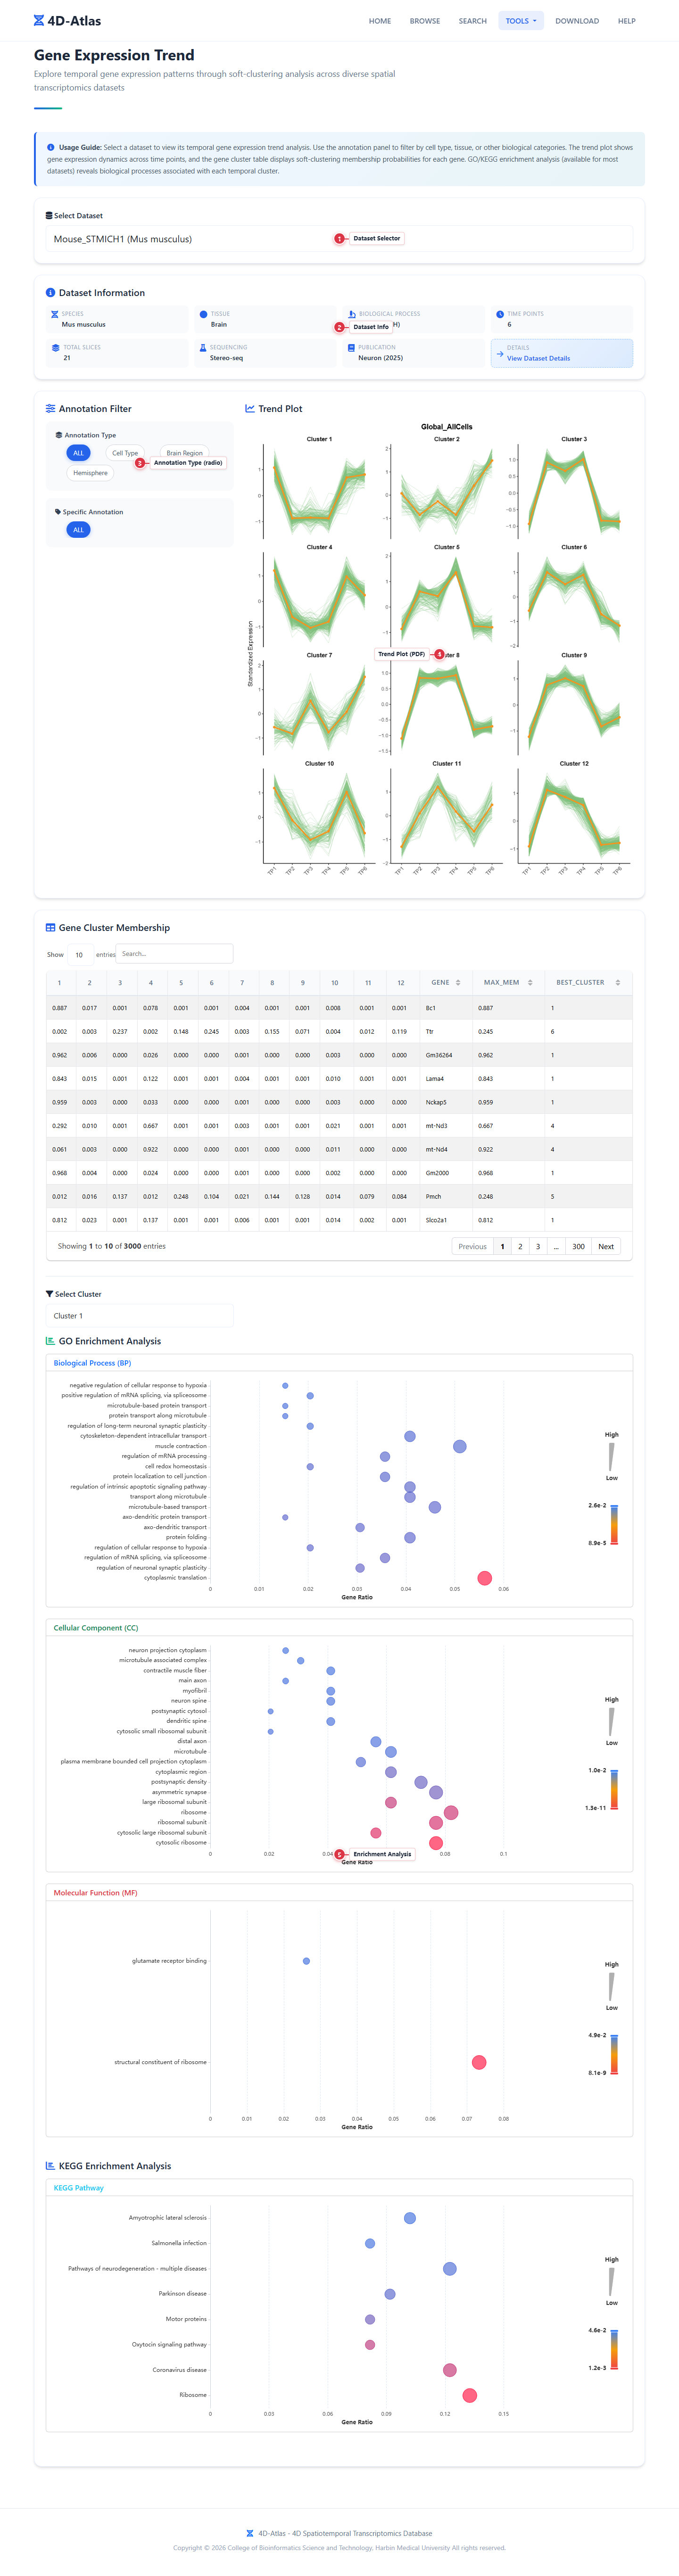
How to Use
- Select a dataset — the info grid and annotation options load.
- Choose an Annotation Type (radio buttons), then select a Specific Annotation or "ALL".
- The Trend Plot (PDF) shows gene expression patterns across timepoints.
- Browse the Gene Clusters table.
- Select a Cluster to view GO and KEGG enrichment analysis.
| # | Element | Description |
|---|---|---|
| 1 | Dataset Selector | Choose which dataset to analyze. |
| 2 | Dataset Info | Grid showing species, tissue, time points, etc. |
| 3 | Annotation Type | Radio buttons: Cell Type, Tissue, Germ Layer, etc. |
| 4 | Specific Annotation | Radio buttons listing each group under the selected type (or ALL). |
| 5 | Trend Plot (PDF) | Gene expression curves across developmental timepoints. |
| 6 | Gene Cluster Table | Genes grouped by expression pattern similarity (searchable, sortable). |
| 7 | Enrichment Analysis | Cluster selector + GO (BP/CC/MF) and KEGG bubble charts with PNG/CSV export buttons. |
Back to top
Download
Download datasets and analysis results in standard bioinformatics formats.
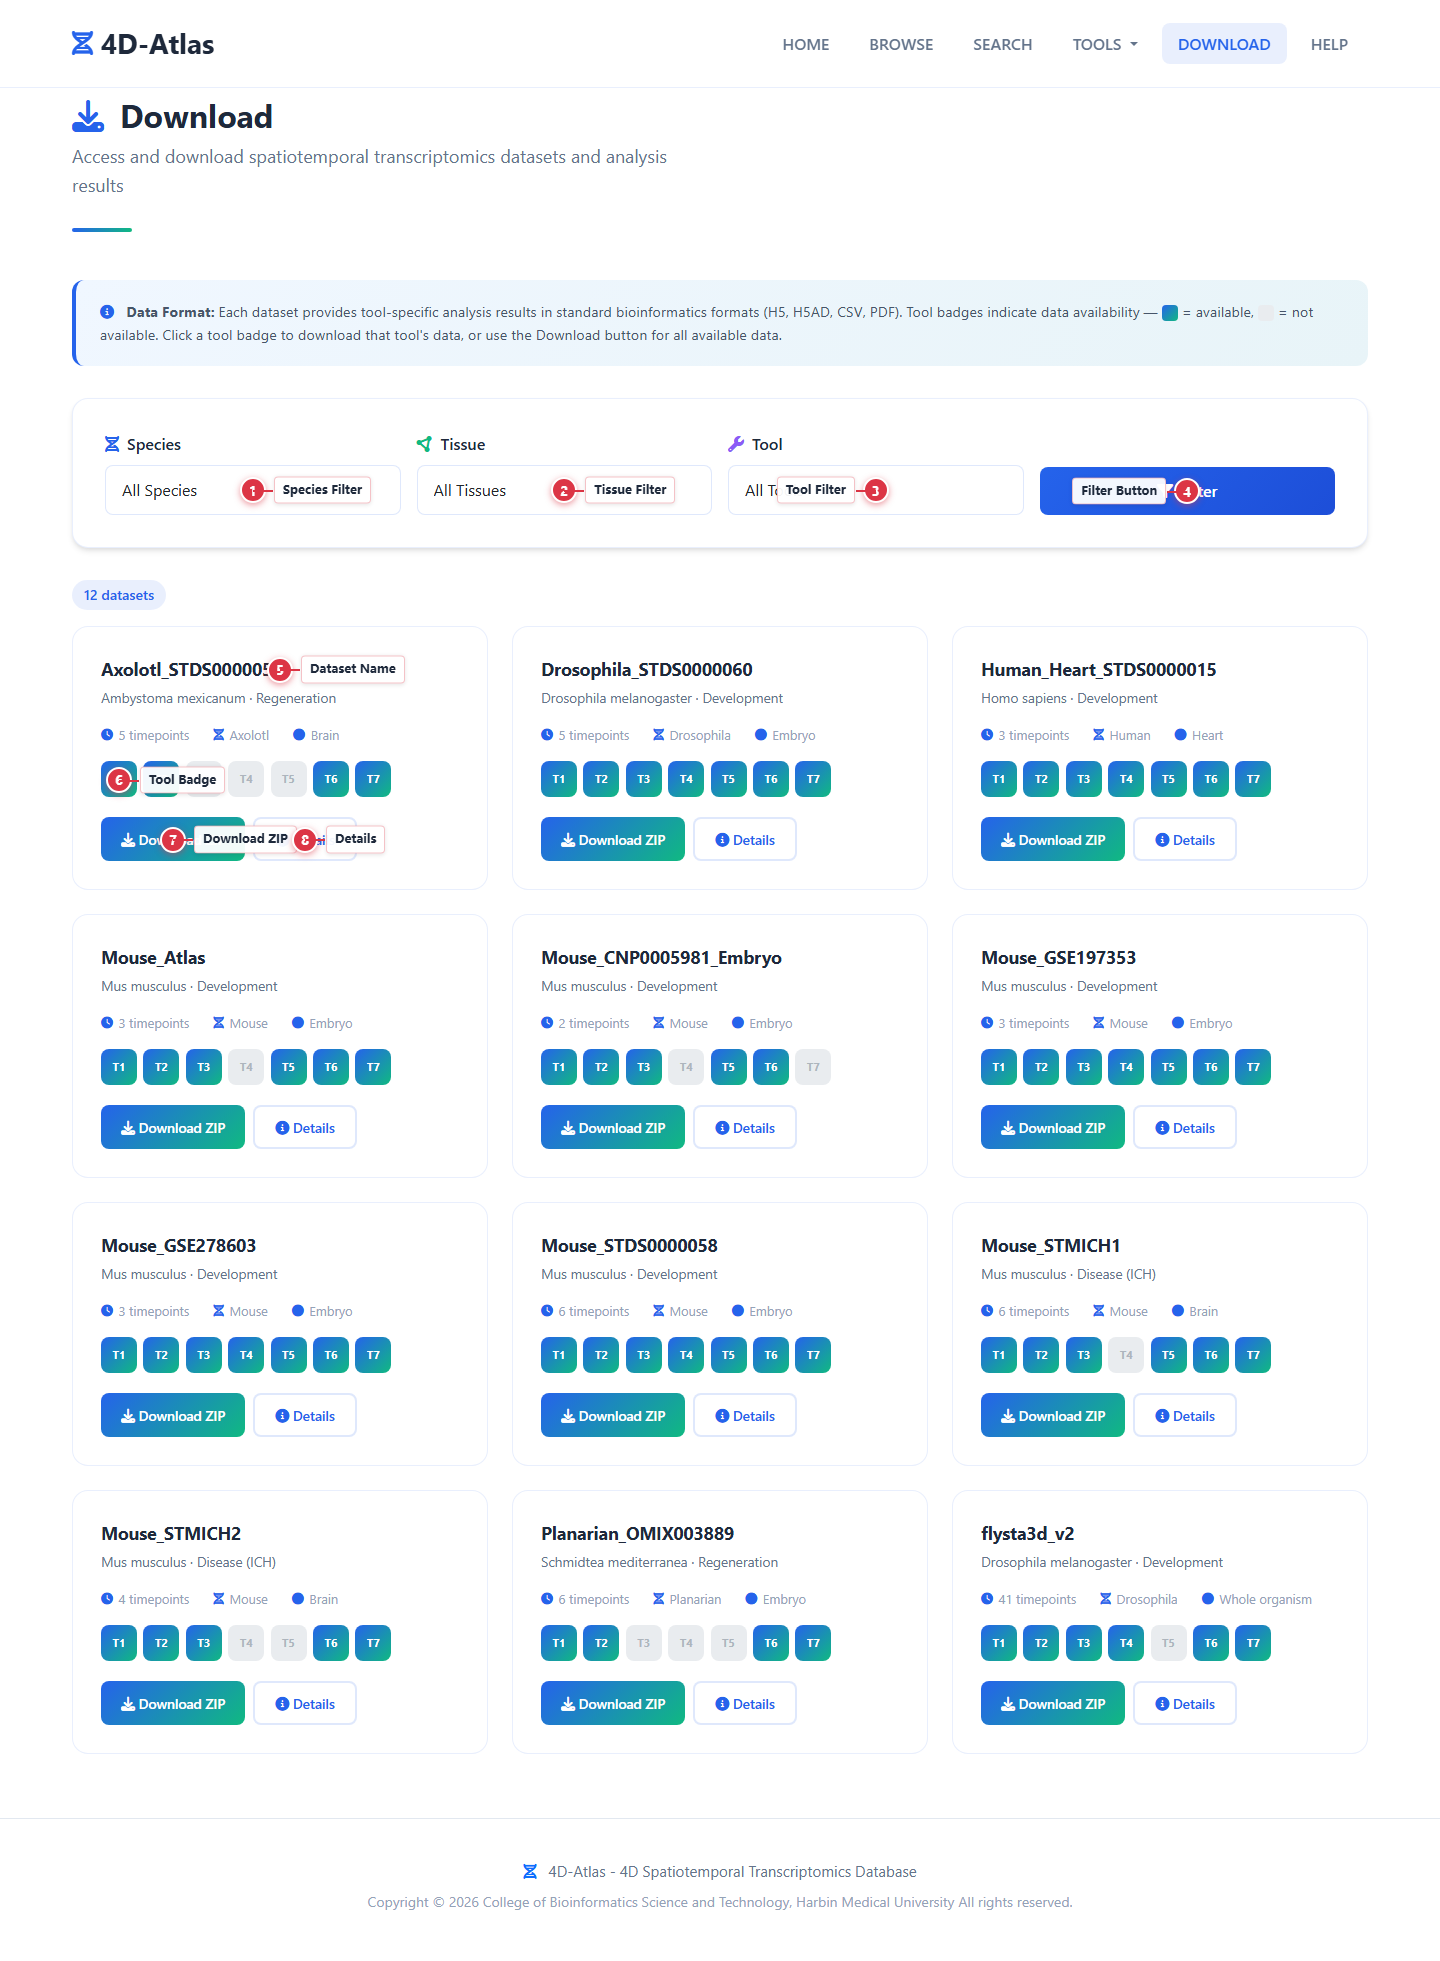
How to Use
- Use the filter bar to narrow datasets by Species, Tissue, or Tool.
- Click Filter to apply.
- Each dataset card shows tool badges (T1–T7). Click a badge to download that tool's data.
- Click "Download ZIP" for all available tool data.
- Click "Details" to view full metadata.
| # | Element | Description |
|---|---|---|
| 1 | Species Filter | Filter by species. |
| 2 | Tissue Filter | Filter by tissue type. |
| 3 | Tool Filter | Filter by specific tool (1–7). |
| 4 | Filter Button | Apply filters. |
| 5 | Dataset Name | Unique dataset identifier (card header). |
| 6 | Tool Badge | Numbered badge (T1–T7) with data size. Colorful = has data (click to download). Gray = no data. |
| 7 | Download ZIP | Download all available tool data as ZIP (shows total size). |
| 8 | Details Button | View dataset detail page. |
Data Formats
| Tool | Format | Contents |
|---|---|---|
| Tool 1 | H5 | 4D atlas matrix + expression matrix |
| Tool 2 | PDF + CSV | Heatmaps, enrichment, module genes |
| Tool 3 | H5AD | Pathway activity scores |
| Tool 4 | H5 + CSV | TF AUC 3D, TF mean, motifs |
| Tool 5 | H5AD | CCC lightweight data |
| Tool 6 | CSV + HTML | TOME trajectories, CellRank drivers |
| Tool 7 | CSV + PDF | Gene clusters, enrichment, trend plots |
Back to top